XRP Price Stays Weak — Bearish Outlook Intact Under $2.60 Resistance


XRP price started a fresh decline from $2.550. The price is now showing bearish signs and is at risk of another decline in the near term.
- XRP price failed to continue higher above $2.550 and corrected some gains.
- The price is now trading below $2.50 and the 100-hourly Simple Moving Average.
- There is a bearish trend line forming with resistance at $2.580 on the hourly chart of the XRP/USD pair (data source from Kraken).
- The pair could start a fresh increase if it stays above $2.410.
XRP Price Dips Again
XRP price formed a short-term top near $2.550 and started a downside correction, like Bitcoin and Ethereum . The price dipped below the $2.520 and $2.50 levels.
There was a move below the 50% Fib retracement level of the upward wave from the $2.377 swing low to the $2.552 high. The price even spiked below $2.42 but remained stable above $2.40. Besides, there is a bearish trend line forming with resistance at $2.580 on the hourly chart of the XRP/USD pair.
The price is now trading below $2.50 and the 100-hourly Simple Moving Average. If there is a fresh upward move, the price might face resistance near the $2.480 level. The first major resistance is near the $2.50 level, above which the price could rise and test $2.550.
A clear move above the $2.550 resistance might send the price toward the $2.580 resistance and the trend line. Any more gains might send the price toward the $2.650 resistance. The next major hurdle for the bulls might be near $2.720.
More Losses?
If XRP fails to clear the $2.580 resistance zone, it could start a fresh decline. Initial support on the downside is near the $2.410 level and the 76.4% Fib retracement level of the upward wave from the $2.377 swing low to the $2.552 high. The next major support is near the $2.380 level.
If there is a downside break and a close below the $2.380 level, the price might continue to decline toward $2.320. The next major support sits near the $2.250 zone, below which the price could continue lower toward $2.20.
Technical Indicators
Hourly MACD – The MACD for XRP/USD is now gaining pace in the bearish zone.
Hourly RSI (Relative Strength Index) – The RSI for XRP/USD is now below the 50 level.
Major Support Levels – $2.410 and $2.380.
Major Resistance Levels – $2.550 and $2.580.

XRP Surge To Unprecedented Heights On Exchanges Before Rapid Correction – Here’s How High
In a shocking flash surge that stunned traders worldwide, XRP’s price briefly skyrocketed to unprece...
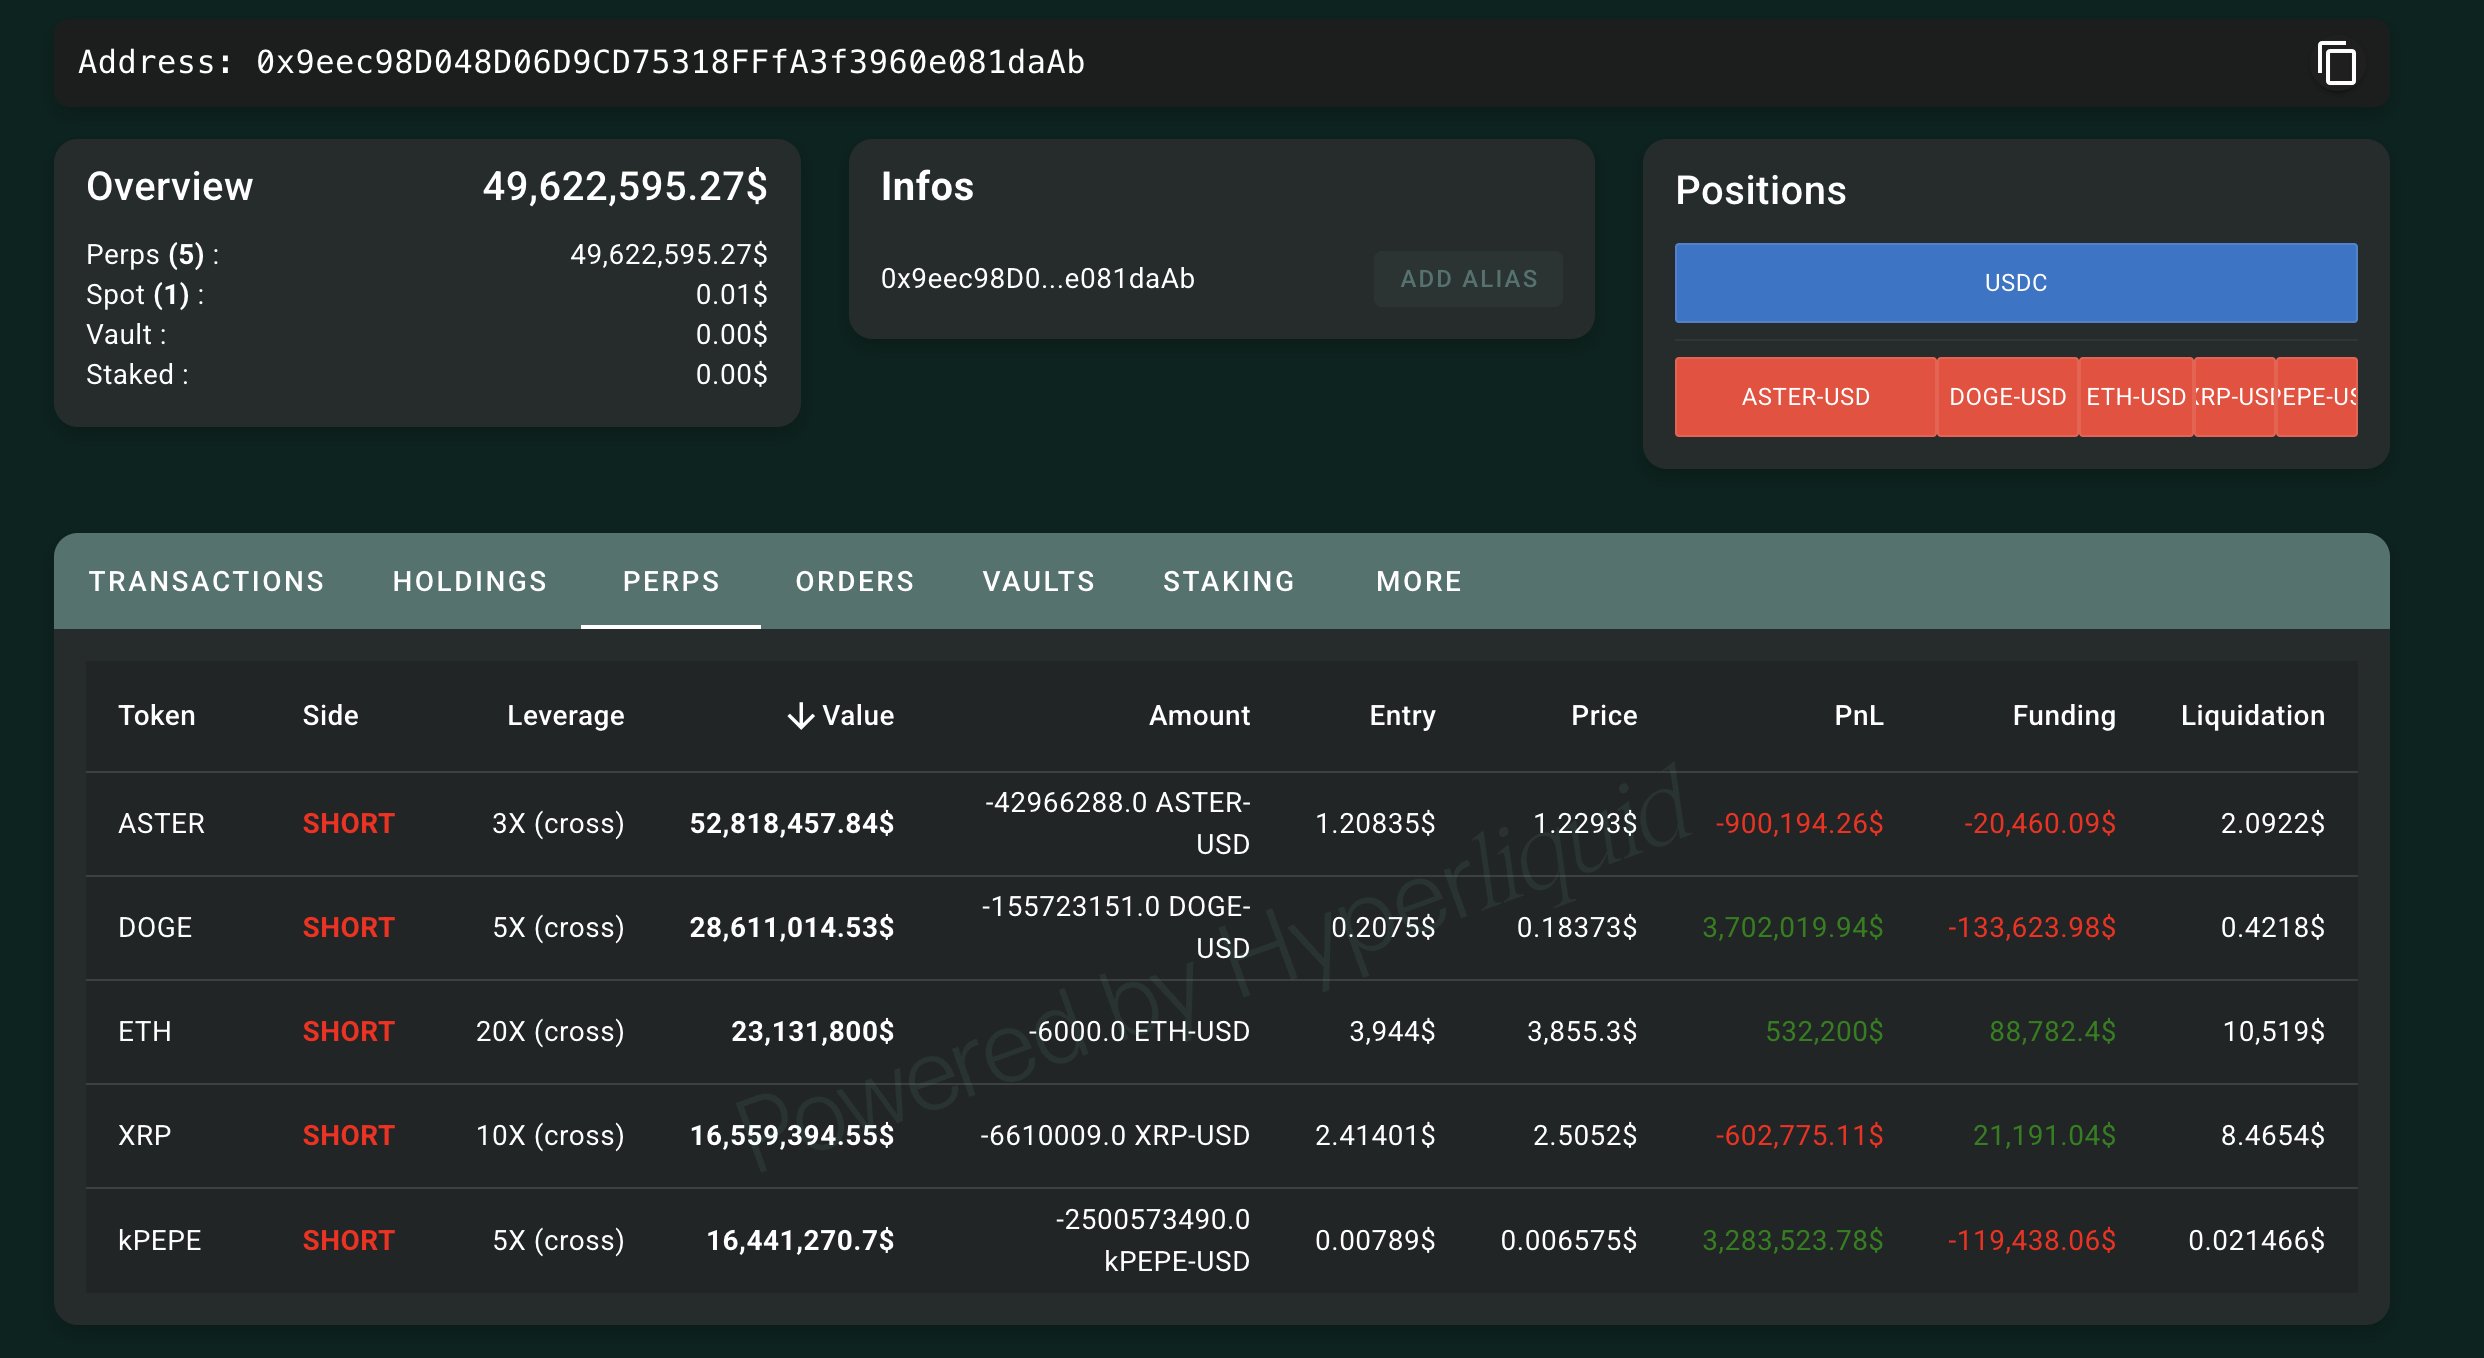
Whale Piles Into ASTER Shorts After CZ’s Comment – $52.8M On the Line
Aster (ASTER) has seen heightened volatility in recent sessions as broader market selling pressure w...
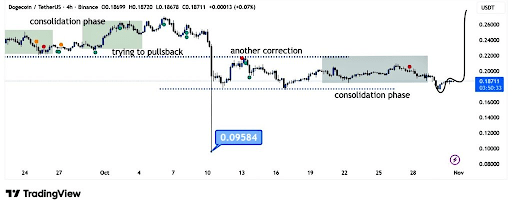
Here’s What Happens To The Dogecoin Price After The Consolidation Phase Ends
Dogecoin has spent the past several days locked in a tight decline that has seen it push lower. The ...