Solana (SOL) Nosedives — Sellers Tighten Grip, Recovery Attempts Fail


Solana started a fresh decline from the $188 zone. SOL price is now consolidating losses below $180 and might decline further below $175.
- SOL price started a fresh decline below $185 and $180 against the US Dollar.
- The price is now trading below $182 and the 100-hourly simple moving average.
- There is a key bearish trend line forming with resistance at $192 on the hourly chart of the SOL/USD pair (data source from Kraken).
- The price could start another increase if the bulls defend $175 or $172.
Solana Price Dips Again
Solana price extended gains above $180 and $182, like Bitcoin and Ethereum . SOL even surpassed $188 before the bears appeared. A high was formed near $189 and the price dropped.
There was a move below $185 and $180. A low was formed at $176, and the price is now consolidating losses with a bearish angle below the 23.6% Fib retracement level of the downward move from the $188 swing high to the $176 low. Besides, there is a key bearish trend line forming with resistance at $192 on the hourly chart of the SOL/USD pair.
Solana is now trading below $185 and the 100-hourly simple moving average. On the upside, immediate resistance is near the $182 level or the 50% Fib retracement level of the downward move from the $188 swing high to the $176 low.
The next major resistance is near the $185 level. The main resistance could be $188. A successful close above the $188 resistance zone could set the pace for another steady increase. The next key resistance is $192 and the trend line. Any more gains might send the price toward the $200 level.
Downside Continuation In SOL?
If SOL fails to rise above the $188 resistance, it could continue to move down. Initial support on the downside is near the $175 zone. The first major support is near the $172 level.
A break below the $172 level might send the price toward the $165 support zone. If there is a close below the $165 support, the price could decline toward the $150 support in the near term.
Technical Indicators
Hourly MACD – The MACD for SOL/USD is gaining pace in the bearish zone.
Hourly Hours RSI (Relative Strength Index) – The RSI for SOL/USD is below the 50 level.
Major Support Levels – $175 and $172.
Major Resistance Levels – $188 and $192.
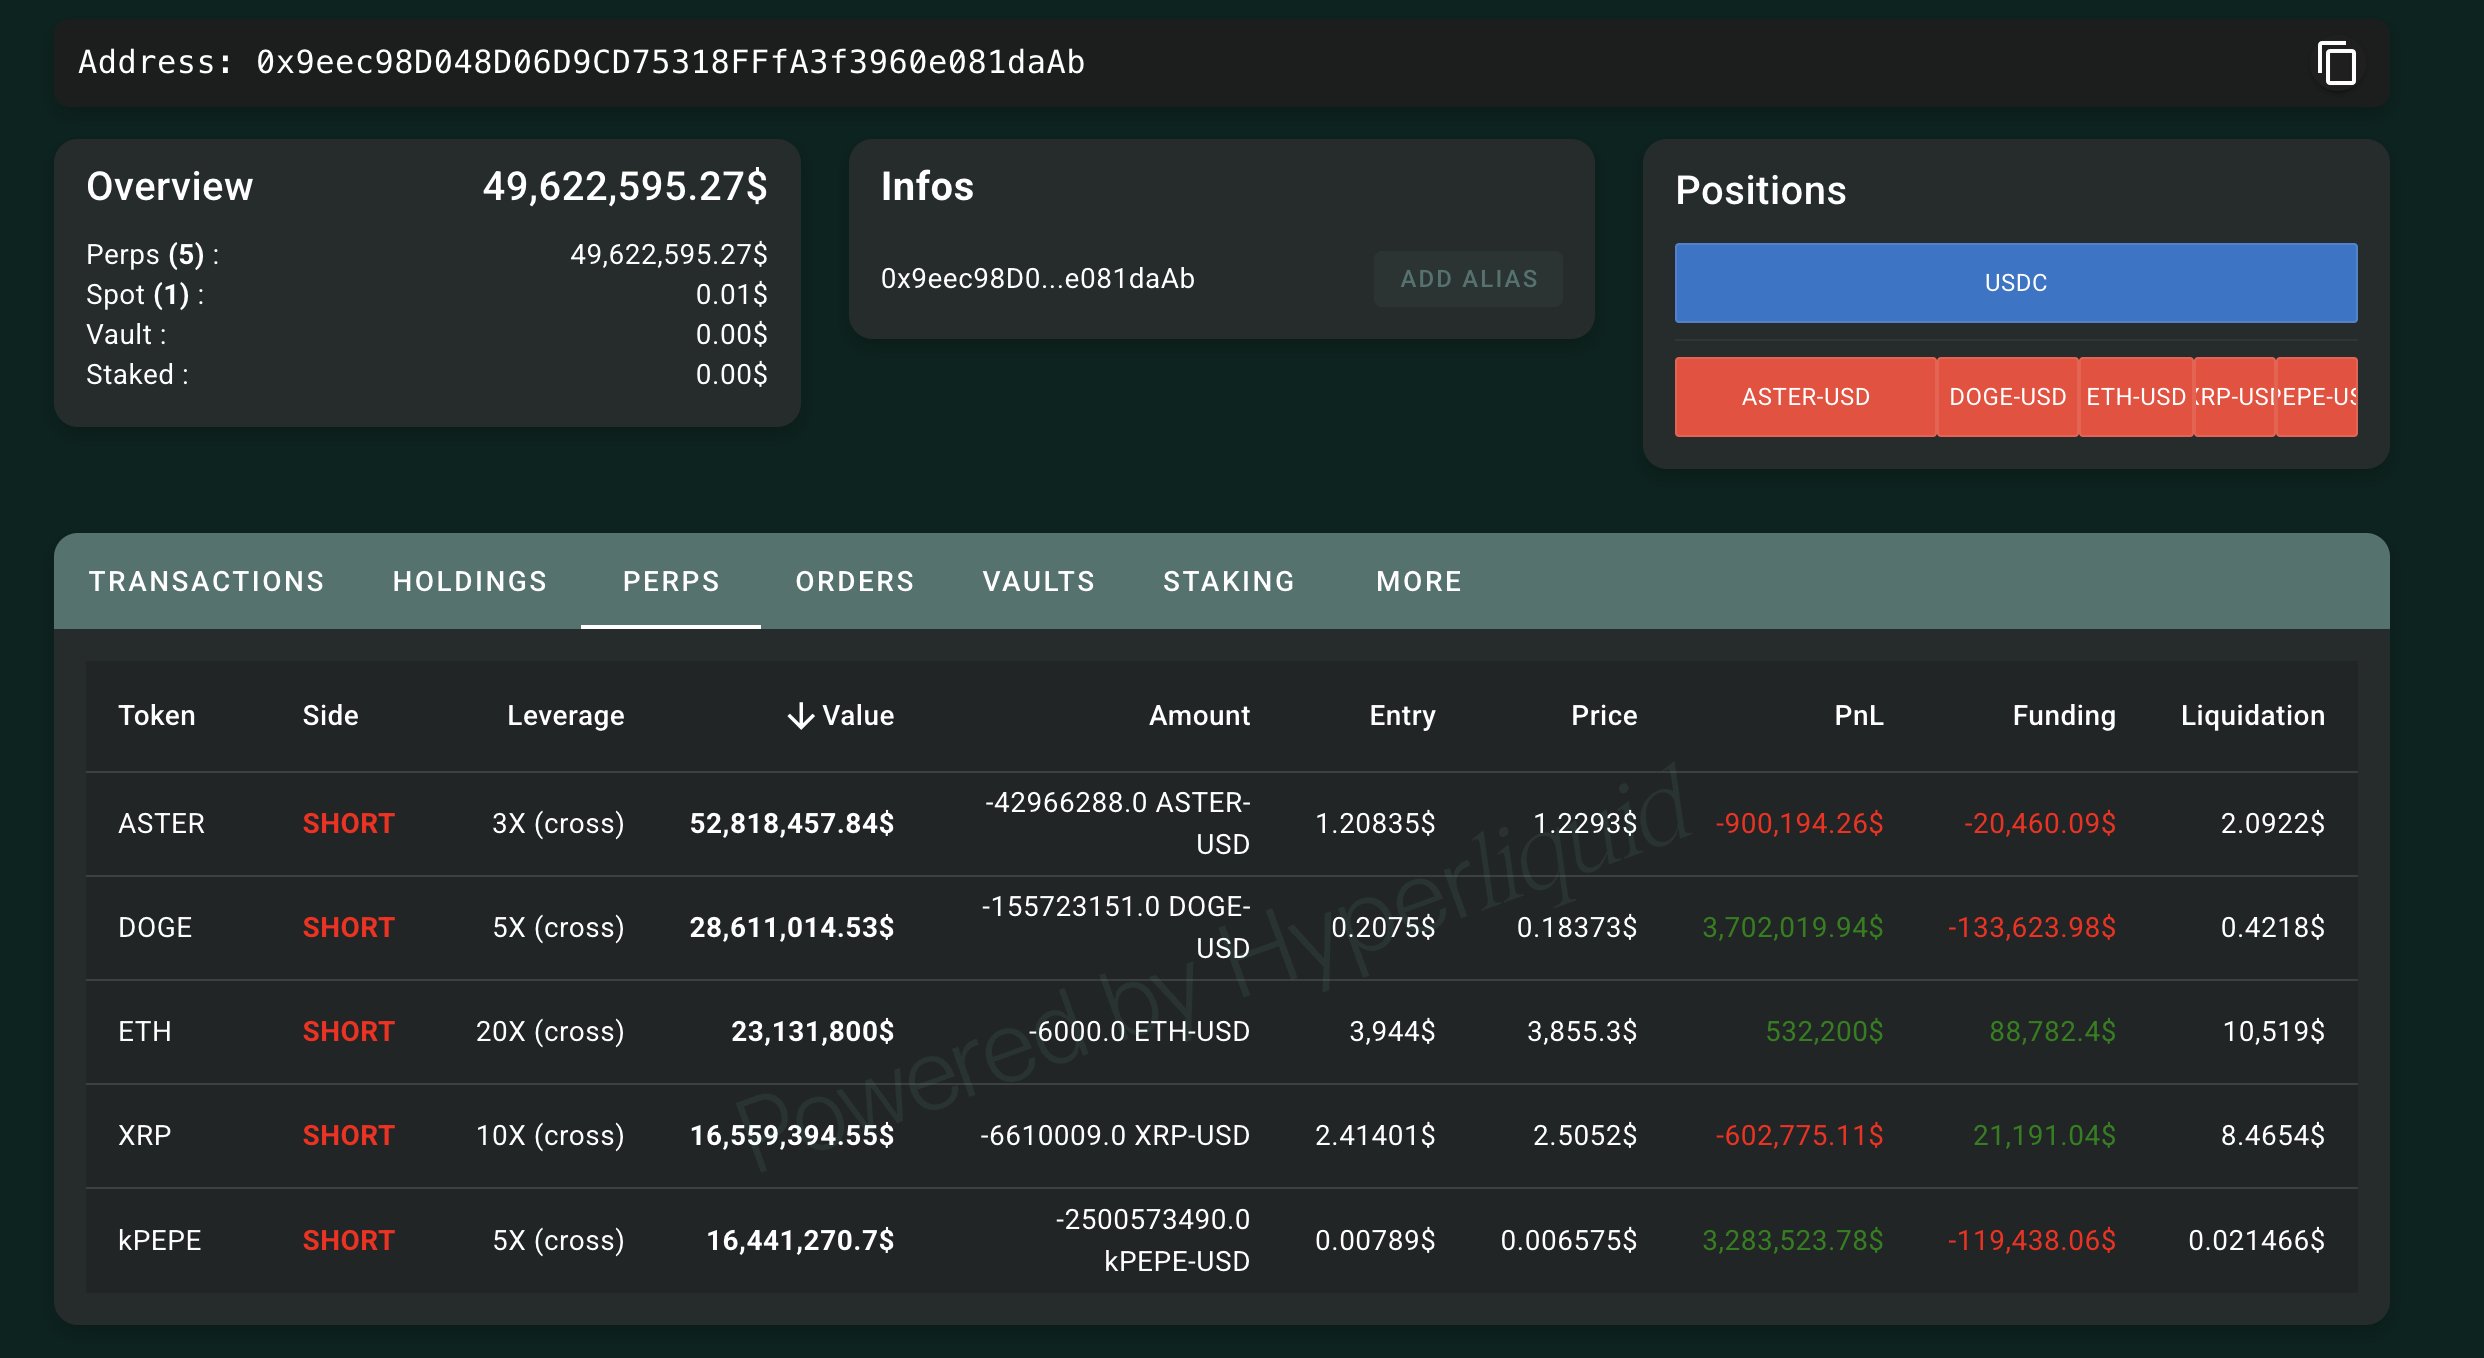
Whale Piles Into ASTER Shorts After CZ’s Comment – $52.8M On the Line
Aster (ASTER) has seen heightened volatility in recent sessions as broader market selling pressure w...
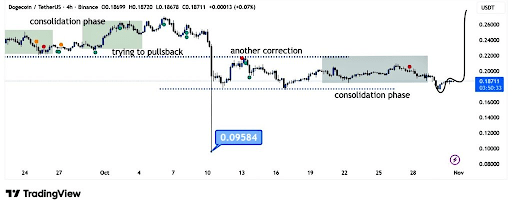
Here’s What Happens To The Dogecoin Price After The Consolidation Phase Ends
Dogecoin has spent the past several days locked in a tight decline that has seen it push lower. The ...
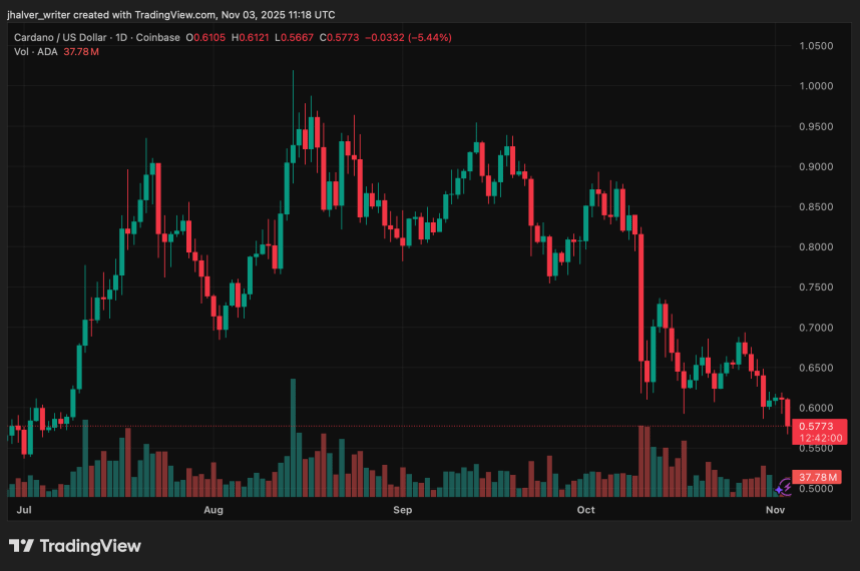
Cardano (ADA) Price Drops 5% Amid Trader Shorts, Hoskinson Blames Community for DeFi Struggles
Cardano (ADA) continued its downward slide on Monday, falling over 5% to trade around $0.57, extendi...