XRP Price Under Fire – Extended Decline Raises Fears Of Another Major Sell-Off


XRP price started a fresh decline below $2.850. The price is now struggling and might continue to move down if it trades below $2.780.
- XRP price is slowly moving lower below the $2.850 zone.
- The price is now trading below $2.850 and the 100-hourly Simple Moving Average.
- There is a key bearish trend line forming with resistance at $2.8350 on the hourly chart of the XRP/USD pair (data source from Kraken).
- The pair could start a fresh decline if it settles below $2.780.
XRP Price Dips Again
XRP price failed to stay above $2.950 and started a fresh decline, like Bitcoin and Ethereum . The price declined below $2.920 and $2.90 to enter a short-term bearish zone.
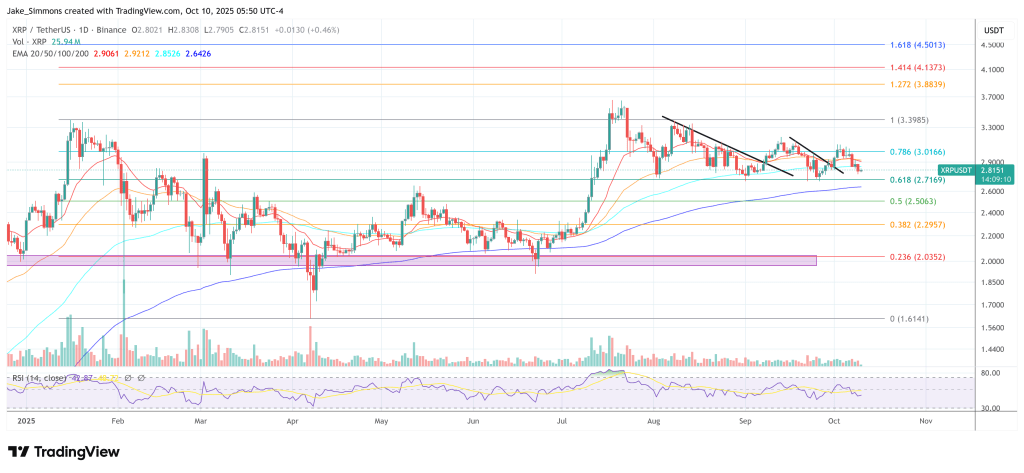
The price tested the $2.770 zone and recently attempted a recovery wave. It is now approaching the 23.6% Fib retracement level of the downward move from the $3.05 swing high to the $2.770 swing low. However, the price could face hurdles near $2.850.
The price is now trading below $2.850 and the 100-hourly Simple Moving Average. Besides, there is a key bearish trend line forming with resistance at $2.8350 on the hourly chart of the XRP/USD pair. If there is a fresh upward move, the price might face resistance near the $2.8350 level.
The first major resistance is near the $2.90 level. A clear move above the $2.880 resistance might send the price toward the $2.950 resistance and the 61.8% Fib retracement level of the downward move from the $3.05 swing high to the $2.770 swing low. Any more gains might send the price toward the $3.00 resistance. The next major hurdle for the bulls might be near $3.050.
More Losses?
If XRP fails to clear the $2.920 resistance zone, it could start a fresh decline. Initial support on the downside is near the $2.780 level. The next major support is near the $2.750 level.
If there is a downside break and a close below the $2.750 level, the price might continue to decline toward $2.720. The next major support sits near the $2.650 zone, below which the price could continue lower toward $2.60.
Technical Indicators
Hourly MACD – The MACD for XRP/USD is now gaining pace in the bearish zone.
Hourly RSI (Relative Strength Index) – The RSI for XRP/USD is now below the 50 level.
Major Support Levels – $2.780 and $2.750.
Major Resistance Levels – $2.90 and $2.920.

Bitcoin Who? XRP Leads Coinbase Search Charts, Beating The Giants
According to Coinbase’s internal metrics shared by community figure Moonkie, XRP drew 32,000 searche...
Is The XRP Bottom In? Pundit Claims ‘Sellers Are Exhausted’
Crypto commentator Zach Rector argues that XRP’s months-long malaise is nearing a turning point, con...
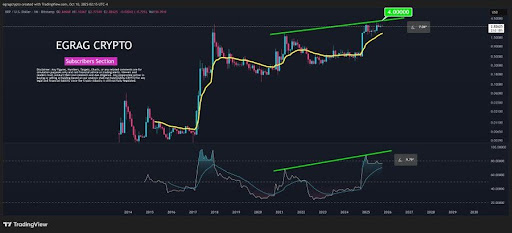
XRP Bullish Symphony: Price And RSI Align For A Run Toward $4
XRP is showing signs of a powerful bullish resurgence as both price action and momentum indicators m...