BNB Price Rally Nears $1,000 – Can Bulls Push Even Higher?


BNB price is gaining pace above the $980 zone. The price is now showing positive signs and might aim for a move above the $1,000 handle in the near term.
- BNB price started a fresh increase above the $950 and $975 levels.
- The price is now trading above $980 and the 100-hourly simple moving average.
- There is a key bullish trend line forming with support at $960 on the hourly chart of the BNB/USD pair (data source from Binance).
- The pair must stay above the $960 level to start another increase in the near term.
BNB Price Hits New ATH
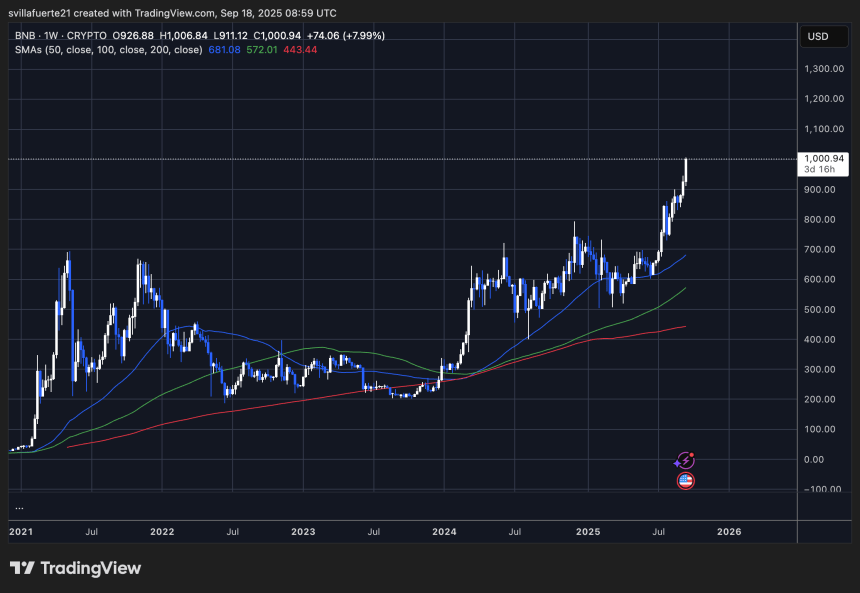
BNB price formed a base above the $900 level and started a fresh increase, beating Ethereum and Bitcoin . There was a steady move above the $940 and $950 levels.
The bulls even cleared the $980 resistance zone. A new all-time high was formed at $995 and the price is now consolidating gains. There was a minor decline and the price tested the 23.6% Fib retracement level of the upward move from the $948 swing low to the $995 high.
The price is now trading above $980 and the 100-hourly simple moving average. Besides, there is a key bullish trend line forming with support at $960 on the hourly chart of the BNB/USD pair.
On the upside, the price could face resistance near the $995 level. The next resistance sits near the $1,000 level. A clear move above the $1,000 zone could send the price higher. In the stated case, BNB price could test $1,050. A close above the $1,050 resistance might set the pace for a larger move toward the $1,120 resistance. Any more gains might call for a test of the $1,150 zone in the near term.
Downside Correction?
If BNB fails to clear the $995 resistance, it could start another decline. Initial support on the downside is near the $980 level. The next major support is near the $970 level or the 50% Fib retracement level of the upward move from the $948 swing low to the $995 high.
The main support sits at $960. If there is a downside break below the $960 support, the price could drop toward the $940 support. Any more losses could initiate a larger decline toward the $920 level.
Technical Indicators
Hourly MACD – The MACD for BNB/USD is gaining pace in the bullish zone.
Hourly RSI (Relative Strength Index) – The RSI for BNB/USD is currently above the 50 level.
Major Support Levels – $970 and $960.
Major Resistance Levels – $995 and $1,000.
Binance Chain BNB Smashes $1,000 Milestone for the First Time Ever
Binance Chain has reached a historic milestone after its native token, BNB, broke past the $1,000 ma...
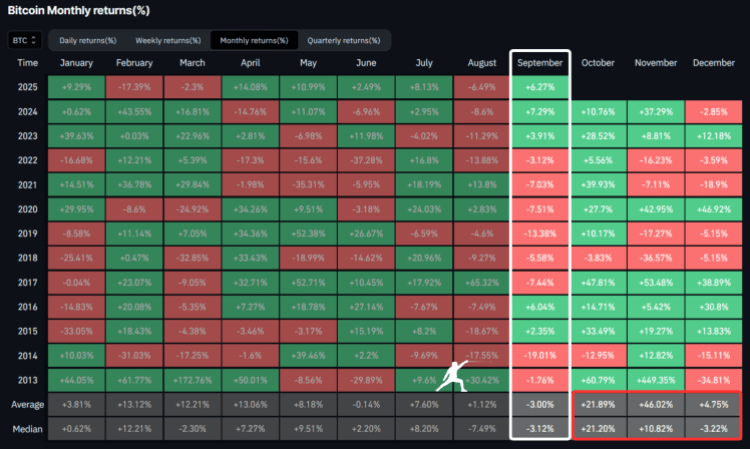
What To Expect From The Bitcoin Price Is September Closes In The Green
Over the years, different trends have emerged for the Bitcoin price depending on how the month ends,...
Powell’s Rate Cut to Fuel Bitcoin Momentum – Bitcoin Hyper Presale Skyrockets Past $16.5M
The US Federal Reserve cut the key interest rate by 0.25 points, with the change coming into effect ...