Bitcoin CEX Netflows Still Green Despite Large Sellers Rotating To Ethereum


Bitcoin is entering a pivotal moment after failing to secure a close above the highly watched $125,000 all-time high. The rejection at this level triggered a sharp retrace, leaving bulls defending critical demand zones around $110,000–$112,000. This range is now seen as the line in the sand that could determine whether BTC resumes its bullish trajectory or faces deeper consolidation.
Market analysts remain divided. Some highlight the resilience of buyers who continue to absorb selling pressure and maintain higher lows. Others, however, warn that failing to reclaim momentum soon could give bears the upper hand and accelerate a correction.
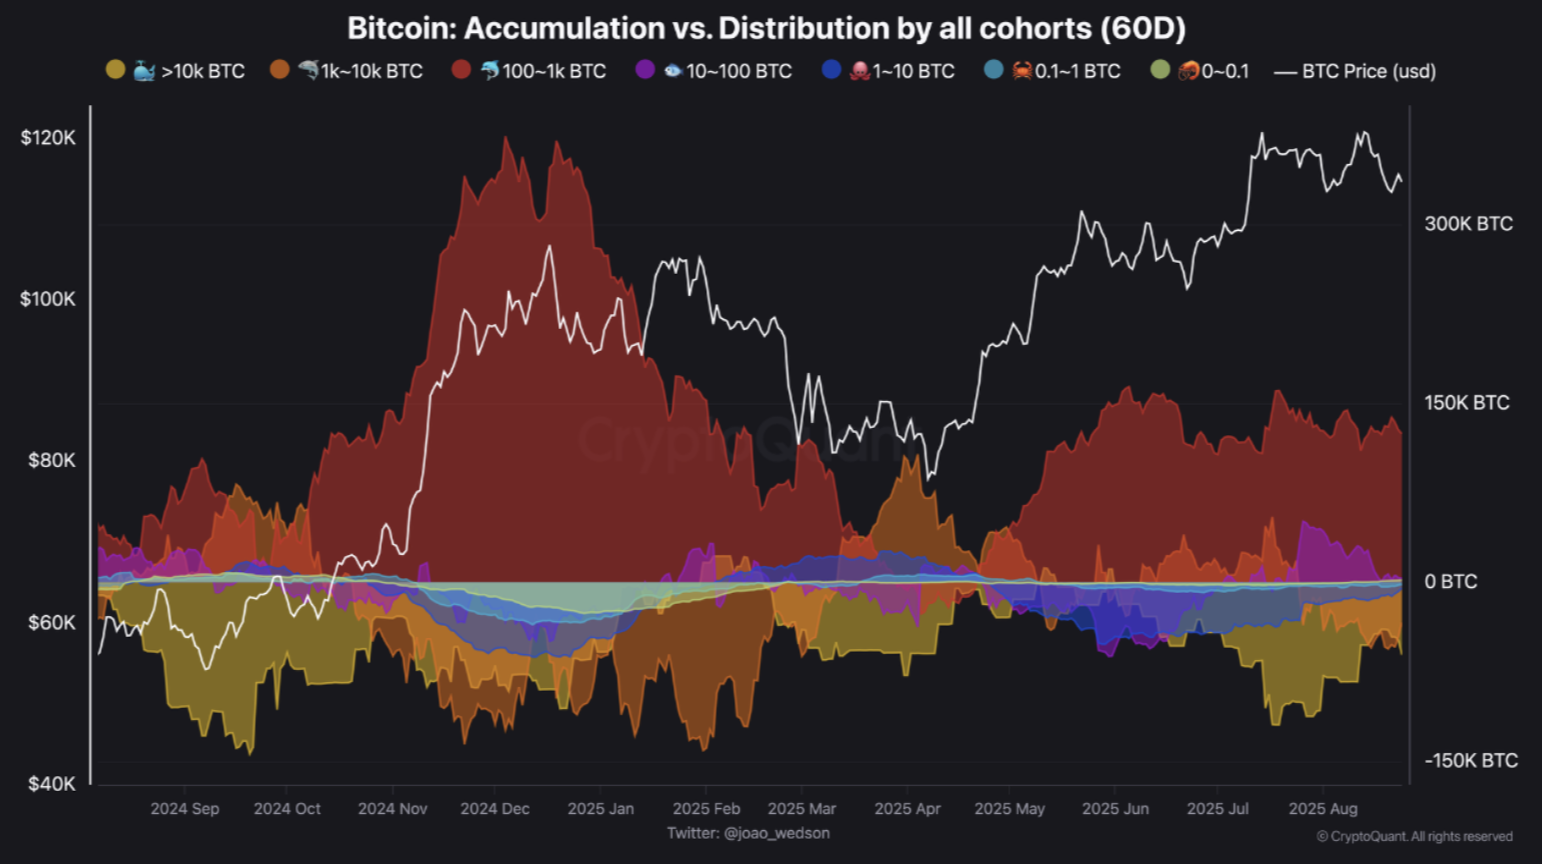
Top analyst Axel Adler expressed caution, noting that large sellers have appeared on centralized exchanges in recent sessions. According to Adler, what’s concerning is that these sellers seem to lack proper execution strategies such as TWAP (Time-Weighted Average Price), which could amplify volatility and put further pressure on short-term price action.
Despite these red flags, overall CEX Netflow remains green, signaling that buyers are still in control for now. However, Adler warns the balance is shifting : if sellers continue to increase their presence, buyers may soon be outnumbered, potentially tipping Bitcoin into a more pronounced downturn.

Bitcoin Bulls Face A Test As Focus Shifts To Ethereum
According to Axel Adler, this phase in Bitcoin’s cycle highlights the changing dynamics of institutional and corporate interest. Adler points out that “right now would be the perfect time for Saylor & Co. to step up their buying,” referencing Michael Saylor and other high-profile corporate investors who have historically supported Bitcoin at key levels. However, Adler also stresses that the corporate sector’s attention has clearly shifted toward Ethereum, where accumulation and leverage activity have been dominating headlines.
This Ethereum frenzy, fueled by both whale accumulation and institutional inflows, has contributed to Bitcoin’s current stall. While ETH rallies toward new highs and captures market liquidity, BTC has consolidated, failing to generate the same momentum seen earlier in the year. For many analysts, this isn’t necessarily bearish—it reflects a rotation of capital within the crypto ecosystem.
From a technical perspective, Bitcoin is testing its previous ATH zone as support, a critical level that bulls must defend. Holding this range could validate the current consolidation as healthy before a new push higher. However, a failure here could open the door to deeper corrections, especially if capital rotation into ETH continues at the current pace.
Testing Support At A Pivotal LevelThe daily Bitcoin chart shows price under pressure after failing to sustain momentum above $123K and reversing sharply lower. BTC is now trading near $111,829, just above the 100-day moving average at $111,567, which is emerging as critical short-term support. The 50-day moving average at $116,544 has flipped into resistance after last week’s breakdown, highlighting a weakening bullish structure.
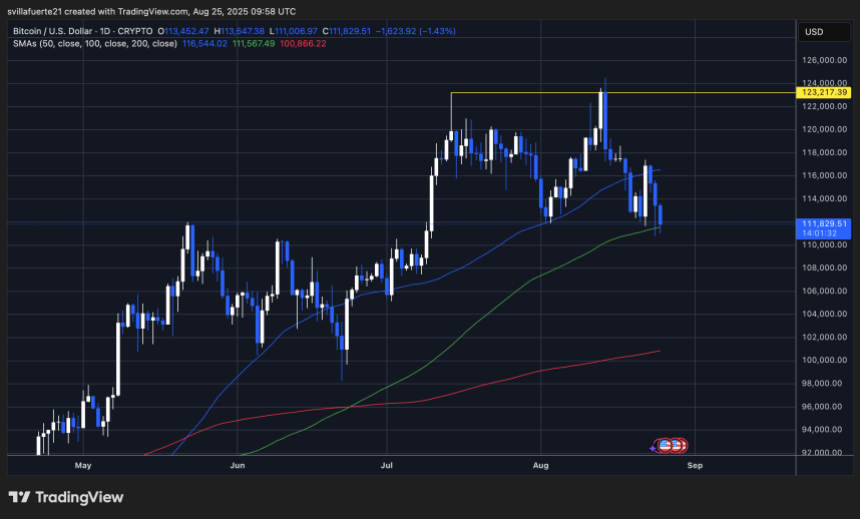
This zone around $111K–$112K is decisive. A confirmed close below would open the door for deeper downside, potentially targeting the 200-day moving average near $100,866, which coincides with a major psychological threshold at $100K. On the upside, bulls must reclaim the $115K–$116K region to regain momentum and set up another attempt at the $123K ATH.
Price action shows that sellers have recently been in control, as reflected by consecutive lower highs and a failure to hold demand above $115K. However, as long as BTC maintains the 100-day MA, the broader uptrend remains intact, suggesting this could develop into a consolidation phase rather than a full reversal.
Featured image from Dall-E, chart from TradingView

Bitcoin Bull Run Under Attack: Expert Says Wall Street Is To Blame
In a new episode of Coin Stories with host Nathalie Brunell, investor and podcaster Preston Pysh off...
Bitcoin Correction Risks Deepen With $105,000 As Critical Support
Following another unsuccessful attempt to create a new all-time high (ATH), Bitcoin (BTC) dropped to...
Bitcoin Correction Risks Deepen With $105,000 As Critical Support
Following another unsuccessful attempt to create a new all-time high (ATH), Bitcoin (BTC) dropped to...