Ethereum Faces Key Resistance as Market Momentum Pauses


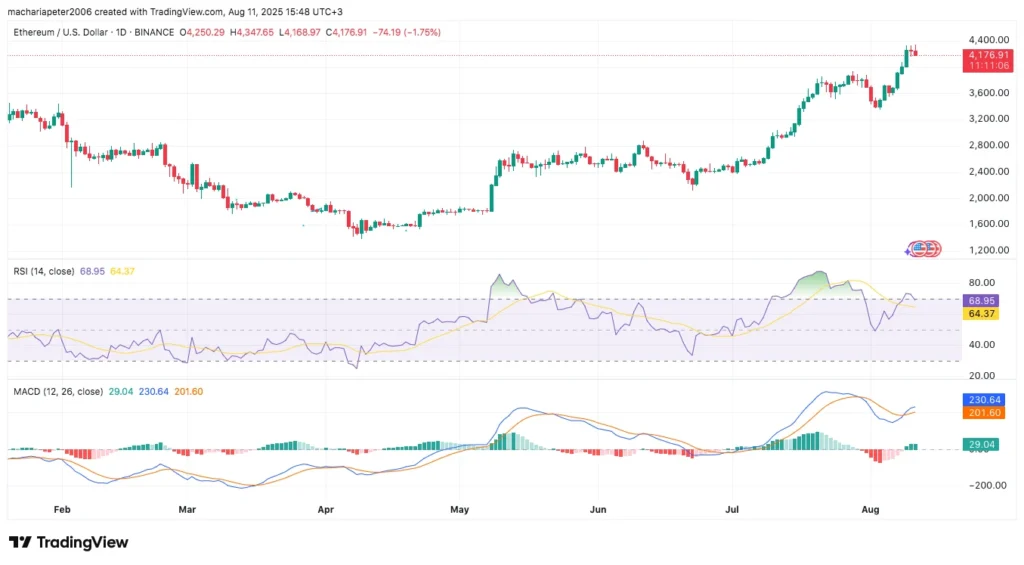
- Ethereum stalls near $4,400 resistance after rally from $3,200–$3,300 consolidation range.
- RSI nears overbought zone while MACD signals ongoing bullish momentum with positive spread.
- Key supports identified at $4,000 and $3,100–$3,400 for potential bounce or accumulation.
Ethereum’s recent rally has pushed its price close to its all-time high, but the advance has stalled near a key resistance level. The cryptocurrency traded at $4,178.46 at the latest session, marking a 0.22% daily decline after peaking above $4,320 earlier in the day. Market capitalization stood at $504.37 billion, with trading volumes over 24 hours reaching $38.34 billion, down 10.27% from the previous period.
Over the latest session, Ethereum opened near $4,199 and rallied in early trading, breaking past $4,300 before selling pressure set in. The price dropped toward $4,180, reducing earlier gains.
Price charts show Ethereum breaking out of a consolidation range between $3,200 and $3,300 before climbing toward a high-resistance area near $4,400. Given the elevated risk, this zone is noted as a possible point for profit-taking or cautious entry. The rally was supported by rising volumes during the breakout, indicating strong participation before the slowdown.
A key short-term support area lies above $4,000, aligned with prior consolidation levels. If this zone is retested, analysts note it could serve as an opening bounce region. A deeper support range between $3,100 and $3,400 is marked as a major accumulation area, coinciding with earlier liquidity groups.
Technical Indicators Show Bullish Bias with Caution
On the daily chart, the Relative Strength Index (RSI) is recorded at 68.95, close to the overbought zone of 70. The RSI’s moving average is lower at 64.37, reflecting recent buying strength. Additionally, long-term readings above 70 may indicate continued upside, while a decline below 65 could signal weakening momentum.

The MACD indicator presents the main line at 230.64 and the signal line at 201.60, which gives a positive spread of 29.04. The histogram is on the positive side and the bars are green, an indication that upward pressure continues to persist. An earlier bullish crossover was made in mid-August after a brief consolidation at the end of July.
If the MACD spread continues expanding and RSI moves above 70, Ethereum may overcome recent highs towards $4,350. Nonetheless, in the event that RSI changes direction moving lower and MACD momentum thins, there are higher chances of the price settling against the support zone of 4,000 to 4,050.

CDARI and Audiera Unite to Bring Fitness, Dance, and Rewards to Web3 Gaming
The partnership is set to revolutionize Web3 gaming as well as social experience by integrating the ...

Aylab Joins CreataChain to Advance Web3 Sports
The purpose of this collaboration is to combine immersive gaming experience with blockchain technolo...

Cache Wallet and Victus Global Ally to Elevate Crypto Security and Accessibility
Cache Wallet taps Victus Global to boost crypto security, accessibility by combining secure storage,...

