XRP Price Cuts Back Gains – Correction or Consolidation?


XRP price struggled to continue higher above the $3.10 zone. The price is trimming gains and might decline below the $2.90 support.
- XRP price is correcting gains from the $3.10 zone.
- The price is now trading below $2.980 and the 100-hourly Simple Moving Average.
- There was a break below a bullish trend line with support at $3.060 on the hourly chart of the XRP/USD pair (data source from Kraken).
- The pair could start another increase if it stays above the $2.880 zone.
XRP Price Dips Again
XRP price struggled to continue higher above the $3.10 resistance zone, like Bitcoin and Ethereum . The price formed a short-term top and started a fresh decline below the $3.00 level.
There was a break below a bullish trend line with support at $3.060 on the hourly chart of the XRP/USD pair. The pair dipped below the 23.6% Fib retracement level of the upward move from the $2.730 swing low to the $3.106 high.
The price is now trading below $3.00 and the 100-hourly Simple Moving Average. The bulls are now active near the 50% Fib retracement level of the upward move from the $2.730 swing low to the $3.106 high.
On the upside, the price might face resistance near the $2.950 level. The first major resistance is near the $3.00 level. A clear move above the $3.00 resistance might send the price toward the $3.0650 resistance. Any more gains might send the price toward the $3.10 resistance or even $3.120 in the near term. The next major hurdle for the bulls might be near the $3.20 zone.
More Losses?
If XRP fails to clear the $3.00 resistance zone, it could start another decline. Initial support on the downside is near the $2.920 level. The next major support is near the $2.880 level.
If there is a downside break and a close below the $2.880 level, the price might continue to decline toward the $2.810 support. The next major support sits near the $2.750 zone where the bulls might take a stand.
Technical Indicators
Hourly MACD – The MACD for XRP/USD is now gaining pace in the bearish zone.
Hourly RSI (Relative Strength Index) – The RSI for XRP/USD is now below the 50 level.
Major Support Levels – $2.920 and $2.880.
Major Resistance Levels – $3.00 and $3.10.
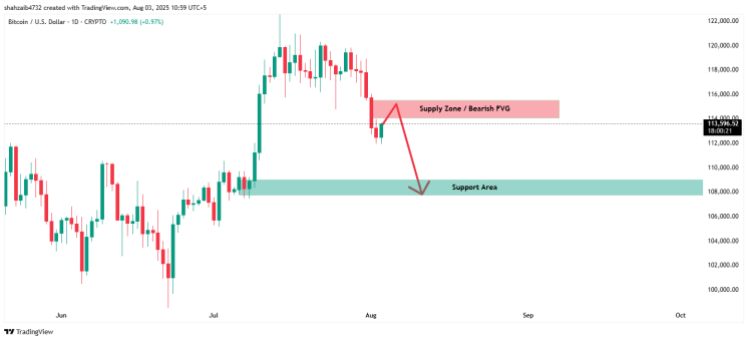
Bitcoin Risks Another Crash Following Recovering Into Bearish FVG Zone
The Bitcoin price has rebounded once again after initially testing the waters with a crash to $112,0...
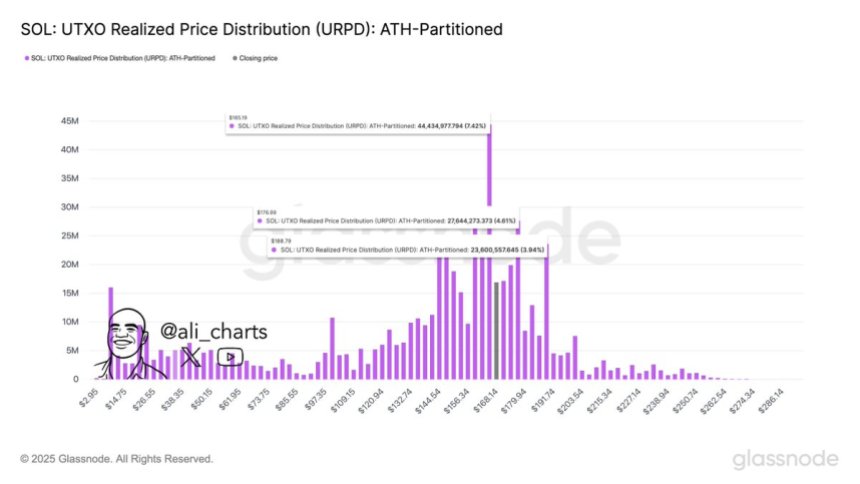
Solana To Drop Before The ‘Real Move’? Analyst Forecasts New Highs In Q3
As Solana (SOL) attempts to reclaim a crucial level, a market watcher forecasted a massive rally for...
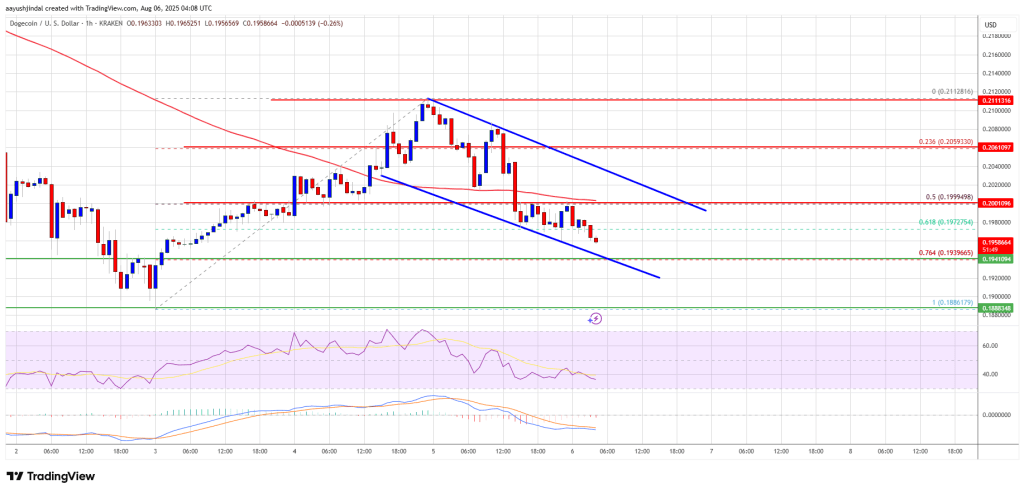
Dogecoin (DOGE) Slides Again—Trend Reversals Signal Pullback Risk
Dogecoin started a fresh decline from the $0.2120 zone against the US Dollar. DOGE is now consolidat...