BNB Price Stalls: Struggles to Resume Gains While Altcoins Rally


BNB price is correcting gains from the $708 zone. The price is now facing hurdles near $692 and might dip again toward the $675 support.
- BNB price is attempting to recover from the $675 support zone.
- The price is now trading below $690 and the 100-hourly simple moving average.
- There is a key bearish trend line forming with resistance at $692 on the hourly chart of the BNB/USD pair (data source from Binance).
- The pair must stay above the $680 level to start another increase in the near term.
BNB Price Faces Hurdles
After a steady increase, BNB price failed to clear the $710 zone. There was a downside correction below the $690 and $680 levels, unlike Ethereum and Bitcoin .
The price even dipped below $678 and tested $675. A low was formed at $674 and the price is now attempting to recover. There was a move above $680. The price climbed above the 50% Fib retracement level of the downward move from the $707 swing high to the $674 low.
However, the bears are active near $692. There is also a key bearish trend line forming with resistance at $692 on the hourly chart of the BNB/USD pair. The price is now trading below $690 and the 100-hourly simple moving average.
On the upside, the price could face resistance near the $692 level. The next resistance sits near the $695 level or the 61.8% Fib retracement level of the downward move from the $707 swing high to the $674 low.
A clear move above the $695 zone could send the price higher. In the stated case, BNB price could test $708. A close above the $708 resistance might set the pace for a larger move toward the $720 resistance. Any more gains might call for a test of the $732 level in the near term.
Another Decline?
If BNB fails to clear the $692 resistance, it could start another decline. Initial support on the downside is near the $682 level. The next major support is near the $680 level.
The main support sits at $674. If there is a downside break below the $674 support, the price could drop toward the $665 support. Any more losses could initiate a larger decline toward the $650 level.
Technical Indicators
Hourly MACD – The MACD for BNB/USD is losing pace in the bullish zone.
Hourly RSI (Relative Strength Index) – The RSI for BNB/USD is currently below the 50 level.
Major Support Levels – $685 and $680.
Major Resistance Levels – $692 and $708.

Bitcoin’s Next Milestone: $250K In Sight After $120K Test, Analyst Says
Bitcoin spent about nine months stuck below $110 K before finally pushing past that ceiling this mon...

XRP Becomes Top 3 Crypto After ProShares ETF Approval, Can It Flip ETH?
The past week has been nothing short of interesting for XRP. Notably, the cryptocurrency has been on...
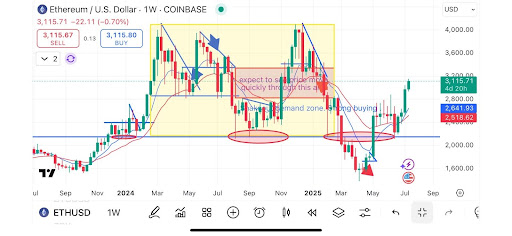
Ethereum Rips Through Thin Zone: A Loud Move After Weeks of Silence
After weeks of whisper-quiet consolidation, Ethereum has finally found its voice, roaring through a ...