Ethereum Smashes Resistance — Is The Next Leg Up Already Here?


Ethereum has broken through the key resistance level that had capped its upside for weeks. After a period of consolidation, ETH gained momentum with higher targets on the table and bullish sentiment starting to build. This breakout may mark the beginning of the next bullish momentum, as technical signals point toward further upside.
Bullish Structure Builds Above Key Support Levels
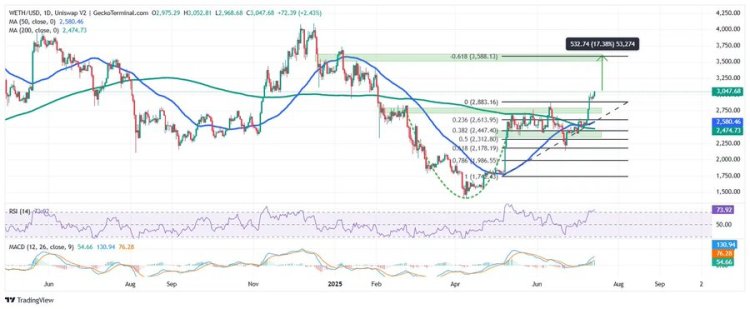
An analyst known as LSplayQ reported on X that the Ethereum price has recently completed a rounded bottom formation on the 1-day chart, signaling a long-term trend reversal, and shifting the market sentiment from bearish to bullish.
Following this information, the ETH price has entered a consolidation phase, forming a tight range just below the $2,880 resistance level. This phase of sideways movement suggests a pause as the market digests recent gains. Ethereum has successfully broken above the $2,880 resistance, while confirming a bullish breakout. This breakout marks the beginning of a fresh upward trend and reinforces the bullish reversal signaled by the rounded bottom.
With the breakout confirmed, ETH price is poised to rally toward the 0.618 Fibonacci extension level at $3,588. This target represents an approximate 17% upside from the current price and is often considered a key resistance area where profit-taking or further acceleration could occur.
However, if ETH encounters bearish pressure, the price could retrace to the 0.236 Fibonacci level at $2,613. The 0 Fibonacci level at $2,883 will then act as immediate short-term support, while holding above this level will be critical to maintaining the bullish momentum and avoiding a deeper pullback.
Crypto analyst TheVALTOR has also revealed that Ethereum has broken the $2,850. This breakout has validated the blue alternative scenario, which had projected a more aggressive bullish path based on the wave count dynamics. Furthermore, the chart shows the completion of an extended red micro wave 3, which is typically the dynamic and impulsive wave within the five-wave sequence.
The ETH price is currently in a correction phase and forming wave 4, which TheVALTOR expected to unfold as a sideways consolidation rather than a sharp pullback.
Consolidation Zone Tightens Below $3,000
The Ethereum 1-hour chart shows an uptrend in recent hours with a minor pullback. According to Gemxbt on X, this retracement has helped establish strong intraday support around $2,950, the level that buyers are defending with conviction.
The Relative Strength Index (RSI) sits in neutral territory, signaling balanced momentum that ETH is neither overbought nor oversold. Meanwhile, the Moving Average Convergence Divergence (MACD) has flashed a bearish crossover, which may indicate short-term weakness or a period of consolidation before the next decisive move.
The key resistance sits at $3,000, which could be a critical level for bullish continuation. This level represents a key psychological threshold that also aligns with previous local highs.


Uniswap’s $73B Growth Fuels Optimism for DeFi and the Best Presales After Leadership Change
Mary-Catherine Lader just stepped down as President and COO of Uniswap Labs after a four-year run th...
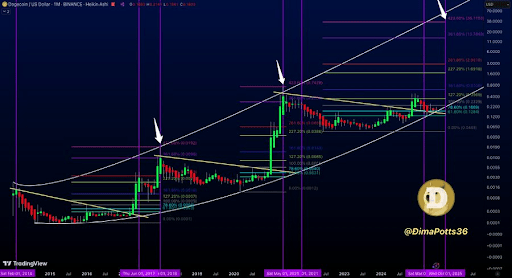
This Fibonacci Level Puts The Dogecoin Price Above $10 This Cycle
Crypto analyst DOGECAPITAL has drawn attention to a Fibonacci level, which suggests that the Dogecoi...
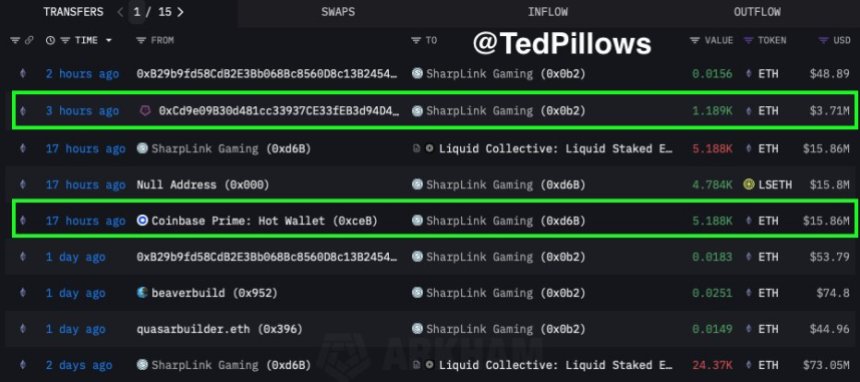
SharpLink Gaming Buys Another $19.5M In Ethereum: Institutional Accumulation Continues
Ethereum is trading confidently above the $3,100 level after breaking through this key resistance wi...