XRP Price Pops and Drops — Can Bulls Regain Control?


XRP price started a strong upward move above the $2.250 zone and tested $2.35. The price is now correcting gains below the $2.30 level.
- XRP price started a fresh increase above the $2.250 zone.
- The price is now trading above $2.250 and the 100-hourly Simple Moving Average.
- There was a break below a bullish trend line with support at $2.2650 on the hourly chart of the XRP/USD pair (data source from Kraken).
- The pair could start another increase if it stays above the $2.240 zone.
XRP Price Fails To Retains Gains
XRP price started a fresh increase after it settled above the $2.250 level, beating Bitcoin and Ethereum . The price was able to climb above the $2.2850 resistance level.
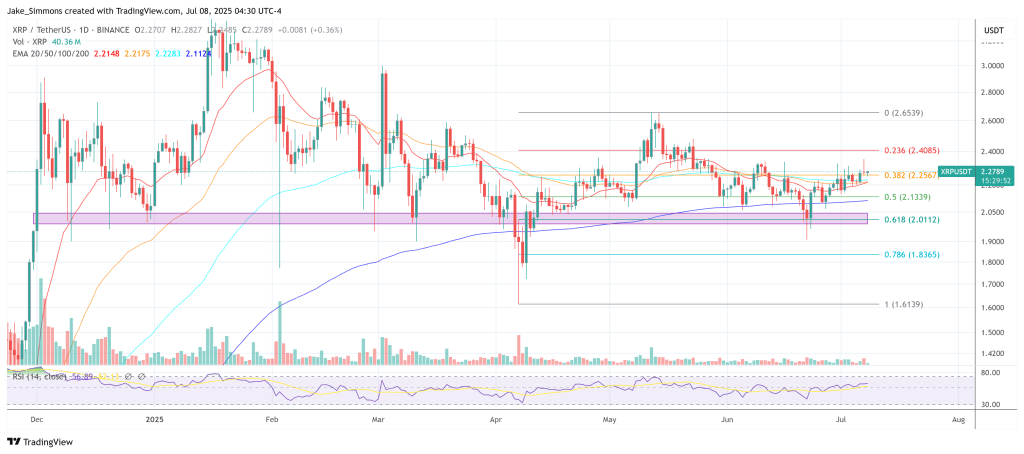
The bulls were able to push the price above the $2.30 level. However, the bears remained active near the $2.350 zone. The price faced rejection and started a fresh decline. It declined below the 50% Fib retracement level of the upward move from the $2.205 swing low to the $2.353 high.
Besides, there was a break below a bullish trend line with support at $2.2650 on the hourly chart of the XRP/USD pair. The price is now trading above $2.250 and the 100-hourly Simple Moving Average.
On the upside, the price might face resistance near the $2.280 level. The first major resistance is near the $2.2880 level. A clear move above the $2.2880 resistance might send the price toward the $2.320 resistance. Any more gains might send the price toward the $2.350 resistance or even $2.3650 in the near term. The next major hurdle for the bulls might be $2.40.
More Losses?
If XRP fails to clear the $2.2880 resistance zone, it could start another decline. Initial support on the downside is near the $2.250 level. The next major support is near the $2.240 level and the 76.4% Fib retracement level of the upward move from the $2.205 swing low to the $2.353 high.
If there is a downside break and a close below the $2.240 level, the price might continue to decline toward the $2.220 support. The next major support sits near the $2.20 zone.
Technical Indicators
Hourly MACD – The MACD for XRP/USD is now gaining pace in the bearish zone.
Hourly RSI (Relative Strength Index) – The RSI for XRP/USD is now below the 50 level.
Major Support Levels – $2.250 and $2.240.
Major Resistance Levels – $2.2880 and $2.320.
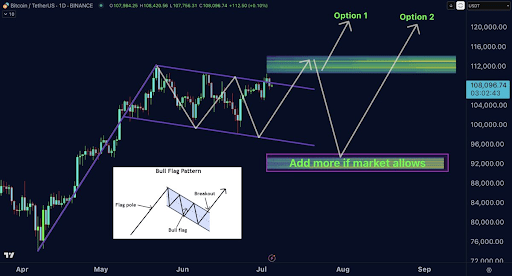
Bitcoin Price Crash To $92,000 Or New ATHs? Analyst Explains The 2 Options
Bitcoin’s recent price action is holding firm above the $108,000 level despite a string of minor pul...

PEPE Traders Spot Breakout Echo—Explosive Surge Back On The Table?
Based on reports from the trading account Bitcoinensus on X, PEPE has formed a pattern that led to a...
Pundit Explains Why XRP Stands To Gain Big From Ripple’s RLUSD
Ripple’s dollar-pegged stablecoin, Ripple USD (RLUSD), has spent the past six months quietly becomin...