Bitcoin Price Stalls Below $110K — Another Rejection for Bulls


Bitcoin price started a fresh decline from the $110,000 zone. BTC is now declining and might trade below the $107,500 support zone.
- Bitcoin started a fresh decline from the $110,000 zone.
- The price is trading below $108,500 and the 100 hourly Simple moving average.
- There was a break below a key bullish trend line with support at $108,200 on the hourly chart of the BTC/USD pair (data feed from Kraken).
- The pair could start a fresh increase if it stays above the $106,500 zone.
Bitcoin Price Dips Again
Bitcoin price started a fresh increase after it settled above the $108,500 resistance. BTC cleared many hurdles near $109,000 to start a decent increase but it failed to clear $110,000.
A high was formed at $109,700 and the price started a fresh decline. There was a move below the $109,200 and $108,500 levels. Besides, there was a break below a key bullish trend line with support at $108,200 on the hourly chart of the BTC/USD pair.
Bitcoin is now trading below $108,500 and the 100 hourly Simple moving average . On the upside, immediate resistance is near the $108,150 level. It is close to the 23.6% Fib retracement level of the downward move from the $109,700 swing high to the $107,674 low.
The first key resistance is near the $108,500 level or the 50% Fib retracement level of the downward move from the $109,700 swing high to the $107,674 low. A close above the $108,500 resistance might send the price further higher. In the stated case, the price could rise and test the $110,000 resistance level. Any more gains might send the price toward the $112,000 level. The main target could be $115,000.
More Losses In BTC?
If Bitcoin fails to rise above the $108,500 resistance zone, it could start another decline. Immediate support is near the $107,500 level. The first major support is near the $106,500 level.
The next support is now near the $105,500 zone. Any more losses might send the price toward the $104,200 support in the near term. The main support sits at $103,500, below which BTC might continue to move down.
Technical indicators:
Hourly MACD – The MACD is now gaining pace in the bearish zone.
Hourly RSI (Relative Strength Index) – The RSI for BTC/USD is now below the 50 level.
Major Support Levels – $107,500, followed by $106,500.
Major Resistance Levels – $108,500 and $106,500.
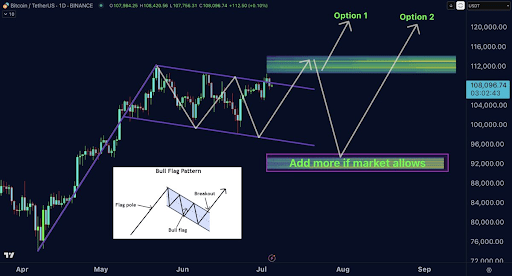
Bitcoin Price Crash To $92,000 Or New ATHs? Analyst Explains The 2 Options
Bitcoin’s recent price action is holding firm above the $108,000 level despite a string of minor pul...

PEPE Traders Spot Breakout Echo—Explosive Surge Back On The Table?
Based on reports from the trading account Bitcoinensus on X, PEPE has formed a pattern that led to a...
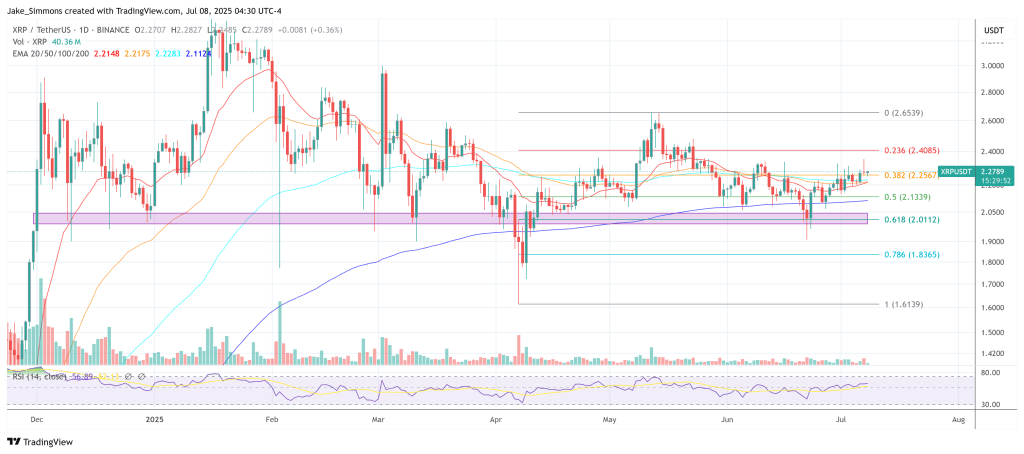
Pundit Explains Why XRP Stands To Gain Big From Ripple’s RLUSD
Ripple’s dollar-pegged stablecoin, Ripple USD (RLUSD), has spent the past six months quietly becomin...