XRP Price Under Pressure — Can It Maintain The Bullish Structure?


XRP price started a downside correction from the $2.220 zone. The price is consolidating and might decline further toward the $2.020 support.
- XRP price started a downside correction below the $2.20 zone.
- The price is now trading below $2.150 and the 100-hourly Simple Moving Average.
- There was a break below a bullish trend line with support at $2.150 on the hourly chart of the XRP/USD pair (data source from Kraken).
- The pair could find bids near the $2.020 zone and start a fresh increase.
XRP Price Dips Below Support
XRP price attempted more gains above the $2.150 zone, like Bitcoin and Ethereum . The price spiked above the $2.20 and $2.220 levels, but the bulls failed to extend gains.
A high was formed at $2.2294 and the price is now correcting gains. There was a move below the $2.20 and $2.15 levels. The price dipped below the 23.6% Fib retracement level of the upward move from the $1.910 swing low to the $2.2294 high.
Besides, there was a break below a bullish trend line with support at $2.150 on the hourly chart of the XRP/USD pair. The price is now trading below $2.180 and the 100-hourly Simple Moving Average.
On the upside, the price might face resistance near the $2.150 level. The first major resistance is near the $2.20 level. The next resistance is $2.220. A clear move above the $2.220 resistance might send the price toward the $2.320 resistance.
Any more gains might send the price toward the $2.40 resistance or even $2.450 in the near term. The next major hurdle for the bulls might be $2.50.
More Losses?
If XRP fails to clear the $2.20 resistance zone, it could start another decline. Initial support on the downside is near the $2.070 level or the 50% Fib retracement level of the upward move from the $1.910 swing low to the $2.2294 high. The next major support is near the $2.020 level.
If there is a downside break and a close below the $2.020 level, the price might continue to decline toward the $2.00 support. The next major support sits near the $1.920 zone.
Technical Indicators
Hourly MACD – The MACD for XRP/USD is now gaining pace in the bearish zone.
Hourly RSI (Relative Strength Index) – The RSI for XRP/USD is now below the 50 level.
Major Support Levels – $2.070 and $2.020.
Major Resistance Levels – $2.20 and $2.220.
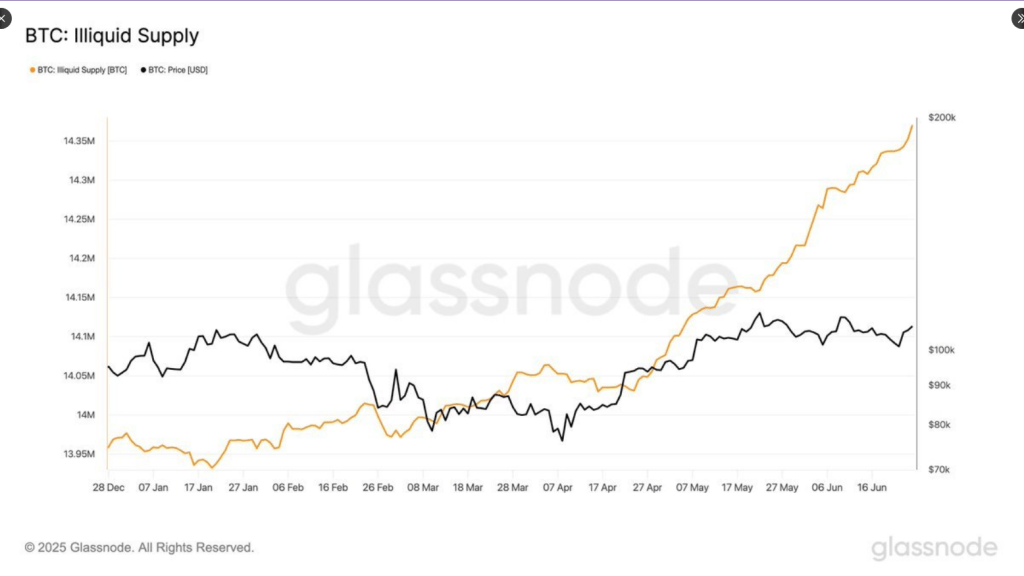
Bitcoin Lockdown: 14 Million BTC Now In Cold Storage As Holders Dig In
According to on-chain analytics firm Glassnode, more than 14 million Bitcoin have sat idle in wallet...
Top Analyst Predicts New Bitcoin Peak Timeline And ‘Double Cycle Blowoff’
Veteran crypto analyst Bob Loukas has delivered a Bitcoin update suggesting that the asset could be ...

XRP Price Declines Back To $2 As Legal Dispute With SEC Continues
The XRP price experienced a significant decline on Thursday following new developments in the ongoin...