Solana (SOL) Breakout Watch: Price Could Rally Hard Above $150 Level?


Solana started a fresh increase from the $125 zone. SOL price is now consolidating gains and aims for more gains above the $150 level.
- SOL price started a fresh increase above the $132 zone against the US Dollar.
- The price is now trading above $142 and the 100-hourly simple moving average.
- There is a key bullish trend line forming with support at $142 on the hourly chart of the SOL/USD pair (data source from Kraken).
- The pair could start a fresh increase if it clears the $150 resistance zone.
Solana Price Aims For More Gains
Solana price remained supported above $125 and started a fresh increase, like Bitcoin and Ethereum . SOL gained pace and traded above the $132 resistance level.
The bulls pushed the price above the $142 and $145 levels. They are now facing hurdles near $148 and $150. A high was formed at $147 and the price is now consolidating gains above the 23.6% Fib retracement level of the upward move from the $126 swing low to the $147 swing high.
Solana is now trading above $142 and the 100-hourly simple moving average. There is also a key bullish trend line forming with support at $142 on the hourly chart of the SOL/USD pair.
On the upside, the price is facing resistance near the $148 level. The next major resistance is near the $150 level. The main resistance could be $155. A successful close above the $155 resistance zone could set the pace for another steady increase. The next key resistance is $160. Any more gains might send the price toward the $165 level.
Another Decline in SOL?
If SOL fails to rise above the $150 resistance, it could start another decline. Initial support on the downside is near the $142 zone. The first major support is near the $136 level or the 50% Fib retracement level of the upward move from the $126 swing low to the $147 swing high.
A break below the $136 level might send the price toward the $130 zone. If there is a close below the $130 support, the price could decline toward the $125 support in the near term.
Technical Indicators
Hourly MACD – The MACD for SOL/USD is losing pace in the bullish zone.
Hourly Hours RSI (Relative Strength Index) – The RSI for SOL/USD is above the 50 level.
Major Support Levels – $142 and $136.
Major Resistance Levels – $148 and $150.
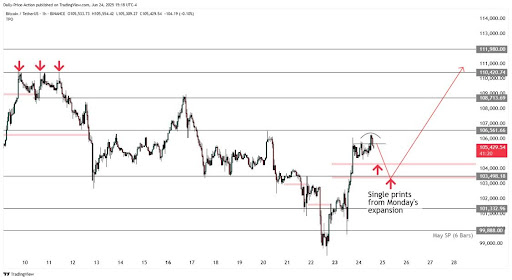
Bitcoin Price Could Rally To $110,000 ATH As These Macroeconomic Factors Align
The Bitcoin price surge above $106,000 this week has reignited bullish sentiment across the market, ...

Stablecoins Approach $250 Billion, Anchoring 8% Of Global Crypto
Based on reports, stablecoin issuance has kept climbing for the past 90 days, with billions of dolla...
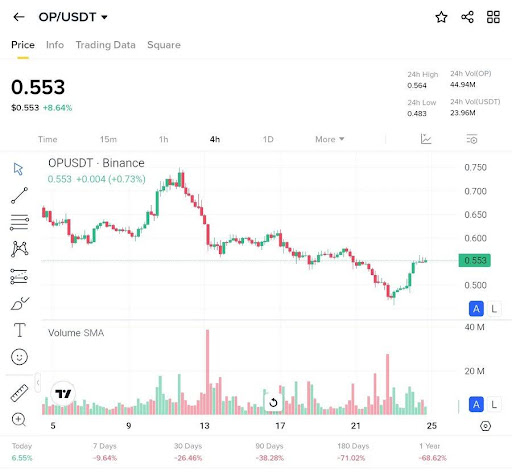
Optimism Flickers At $0.553: A Recovery Or A Pause The Decline?
Crypto Man MAB, in his latest analysis on X, pointed out that Optimism (OP) is now priced at $0.553,...