XRP Price Action Tightens — Breakout Looms to The Upside


XRP price started a fresh decline below the $2.20 zone. The price is now consolidating losses and might recover if it clears the $2.20 hurdle.
- XRP price started a fresh decline below the $2.150 zone.
- The price is now trading below $2.20 and the 100-hourly Simple Moving Average.
- There is a contracting triangle forming with resistance at $2.170 on the hourly chart of the XRP/USD pair (data source from Kraken).
- The pair might start a fresh increase if there is a close above the $2.20 resistance zone.
XRP Price Eyes Upside Break
XRP price reacted to the downside below the $2.20 support zone, like Bitcoin and Ethereum . The price declined below the $2.180 and $2.150 support levels.
The pair tested the $2.120 support A low was formed at $2.120 and the price started to trade in a range. There was a minor recovery wave above the 23.6% Fib retracement level of the downward move from the $2.335 swing high to the $2.120 low.
The price is now trading below $2.20 and the 100-hourly Simple Moving Average. On the upside, the price might face resistance near the $2.170 level. There is also a contracting triangle forming with resistance at $2.170 on the hourly chart of the XRP/USD pair.
The first major resistance is near the $2.20 level. The next resistance is $2.2280 or the 50% Fib retracement level of the downward move from the $2.335 swing high to the $2.120 low.
A clear move above the $2.2280 resistance might send the price toward the $2.250 resistance. Any more gains might send the price toward the $2.2850 resistance or even $2.320 in the near term. The next major hurdle for the bulls might be $2.350.
Another Drop?
If XRP fails to clear the $2.20 resistance zone, it could start another decline. Initial support on the downside is near the $2.1450 level. The next major support is near the $2.120 level.
If there is a downside break and a close below the $2.120 level, the price might continue to decline toward the $2.050 support. The next major support sits near the $2.00 zone.
Technical Indicators
Hourly MACD – The MACD for XRP/USD is now losing pace in the bearish zone.
Hourly RSI (Relative Strength Index) – The RSI for XRP/USD is now above the 50 level.
Major Support Levels – $2.1450 and $2.120.
Major Resistance Levels – $2.170 and $2.20.
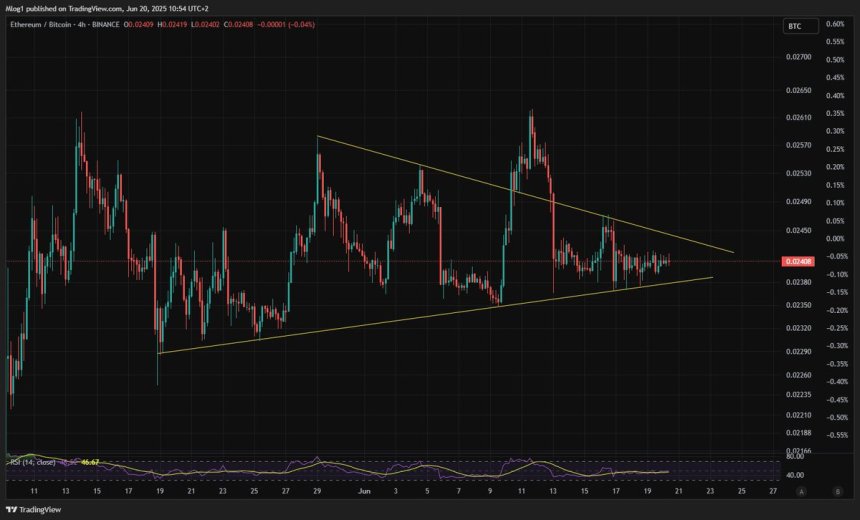
Ethereum Prepares For A Decisive Move: ETH/BTC Setup Could Trigger Altseason
Ethereum is approaching a critical test as price action tightens, setting the stage for a decisive m...
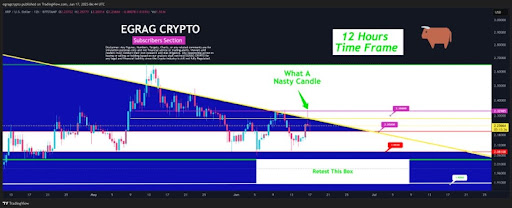
XRP Price In 2026? Pattern From 2017 Reveals How It Will Happen
The XRP price is currently trading well below $3; however, a crypto expert believes that in less tha...
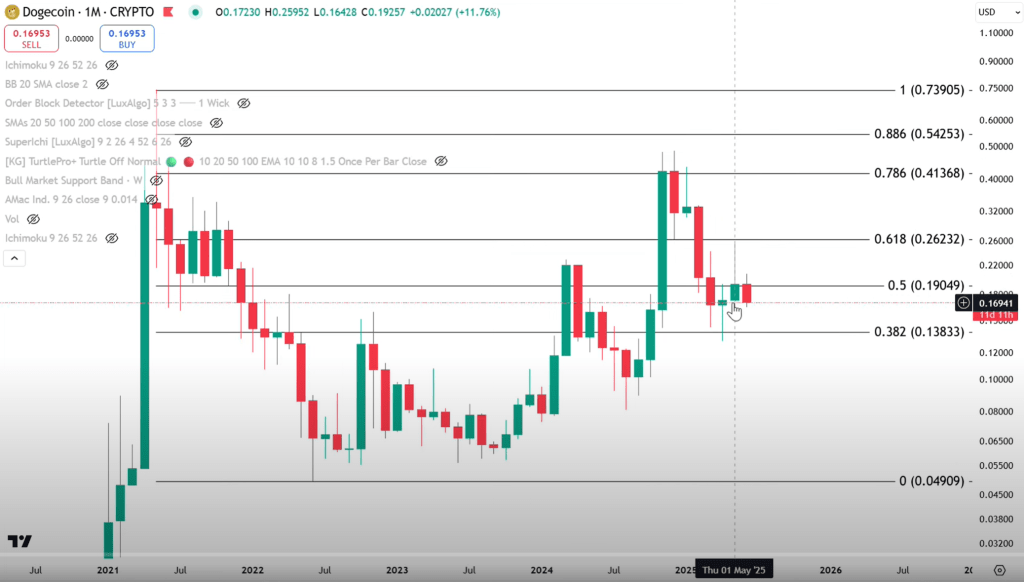
Crypto Analyst Predicts $4 Dogecoin After Exhausted Selling Phase
Dogecoin’s six-month consolidation is a coil, not a coffin, according to the pseudonymous technician...