Cardano (ADA) Faces Trouble at Key Support — Is a Breakdown Looming?


Cardano price started a fresh decline below the $0.680 zone. ADA is now consolidating and might struggle to stay above the $0.620 support.
- ADA price started a fresh decline below $0.70 and $0.680.
- The price is trading below $0.680 and the 100-hourly simple moving average.
- There is a key bullish trend line forming with support at $0.630 on the hourly chart of the ADA/USD pair (data source from Kraken).
- The pair could start a fresh decline if it dips below the $0.620 support zone.
Cardano Price Dips Further
In the past few days, Cardano saw a fresh decline below the $0.720, unlike Bitcoin and Ethereum . ADA even declined below the $0.70 level to enter a bearish zone.
The bears even pushed the price below the $0.680 level. A low was formed at $0.6134 and the price recently corrected some losses. There was a move above the $0.620 and $0.6350 levels. The price climbed above the 23.6% Fib retracement level of the downward move from the $0.7311 swing high to the $0.6134 low.
However, the bears remained active near $0.6560. Cardano price is now trading above $0.620 and the 100-hourly simple moving average. Besides, there is a key bullish trend line forming with support at $0.630 on the hourly chart of the ADA/USD pair.
On the upside, the price might face resistance near the $0.650 zone. The first resistance is near $0.6560. The next key resistance might be $0.6720. It is close to the 50% Fib retracement level of the downward move from the $0.7311 swing high to the $0.6134 low.
If there is a close above the $0.6720 resistance, the price could start a strong rally. In the stated case, the price could rise toward the $0.70 region. Any more gains might call for a move toward $0.7350 in the near term.
Another Drop In ADA?
If Cardano’s price fails to climb above the $0.6720 resistance level, it could start another decline. Immediate support on the downside is near the $0.630 level.
The next major support is near the $0.620 level. A downside break below the $0.620 level could open the doors for a test of $0.60. The next major support is near the $0.5650 level where the bulls might emerge.
Technical Indicators
Hourly MACD – The MACD for ADA/USD is gaining momentum in the bearish zone.
Hourly RSI (Relative Strength Index) – The RSI for ADA/USD is now below the 50 level.
Major Support Levels – $0.630 and $0.620.
Major Resistance Levels – $0.6560 and $0.6720.
Analyst Predicts Bitcoin Price Crash As War Tensions Mount In Middle East
Bitcoin’s recent price activity has been characterized by sharp swings as global uncertainties persi...
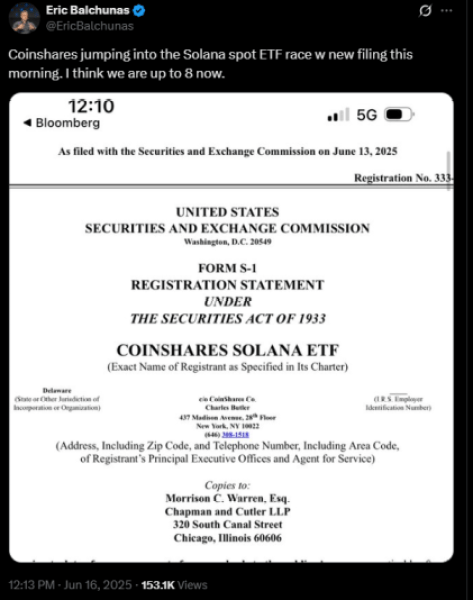
Solana ETF Nears Approval – Don’t Miss Your Chance to Buy Solaxy, the First $SOL Layer-2
Here’s a list of the people who think a Solana ETF is incoming: everyone. And here’s a list of the p...

Wild XRP Prediction: Crypto Founder Sees $10K Price Tag—Here’s When
According to Digital Ascension Group’s Managing Director Jake Claver, XRP could reach a price level ...