Bitcoin Liquidity Builds At $105K Level – Sweep Before New Highs?


Bitcoin finally broke through its all-time highs this week, reaching $112,000 and holding firm above the key psychological level of $100,000. After weeks of steady momentum and bullish consolidation, the breakout marks a major shift in market structure, confirming that bulls are now in full control. The move has reignited optimism across the market, with sentiment turning decisively positive as BTC enters price discovery once again.
The breakout wasn’t just technical—it was backed by strong positioning across derivatives markets. According to data from Coinglass, Bitcoin’s weekly liquidation heatmap reveals a dense cluster of liquidity around the $105,700 level. This area could act as a magnet in the short term, with some traders expecting a brief sweep into that zone before BTC resumes its upward trajectory.
This environment now favors bulls, with both technical levels and on-chain data aligning to support further upside. As long as Bitcoin continues to close above $100K and dips remain shallow, the path of least resistance appears to be higher. With liquidity, momentum, and macro sentiment aligning, the coming weeks could be critical as BTC sets the tone for the rest of the market—and potentially the start of a full-blown bullish phase .
Bitcoin Remains Strong Amid Tight Conditions
Bitcoin posted another bullish week, reaching a new all-time high of $112,000 before pulling back slightly to hold above the key $100,000 level. Despite the strength, market sentiment has yet to flip fully euphoric. A cautiously bullish tone dominates as macroeconomic conditions remain tight, with high US Treasury yields and growing instability in global trade continuing to weigh on risk assets.
Unlike many altcoins, which are still trading well below their previous cycle highs, Bitcoin appears to be thriving in this high-stress environment. Its resilience is being closely watched, as capital continues to favor BTC over smaller, more volatile assets. This relative strength reinforces Bitcoin’s status as a macro hedge, especially in uncertain economic conditions.
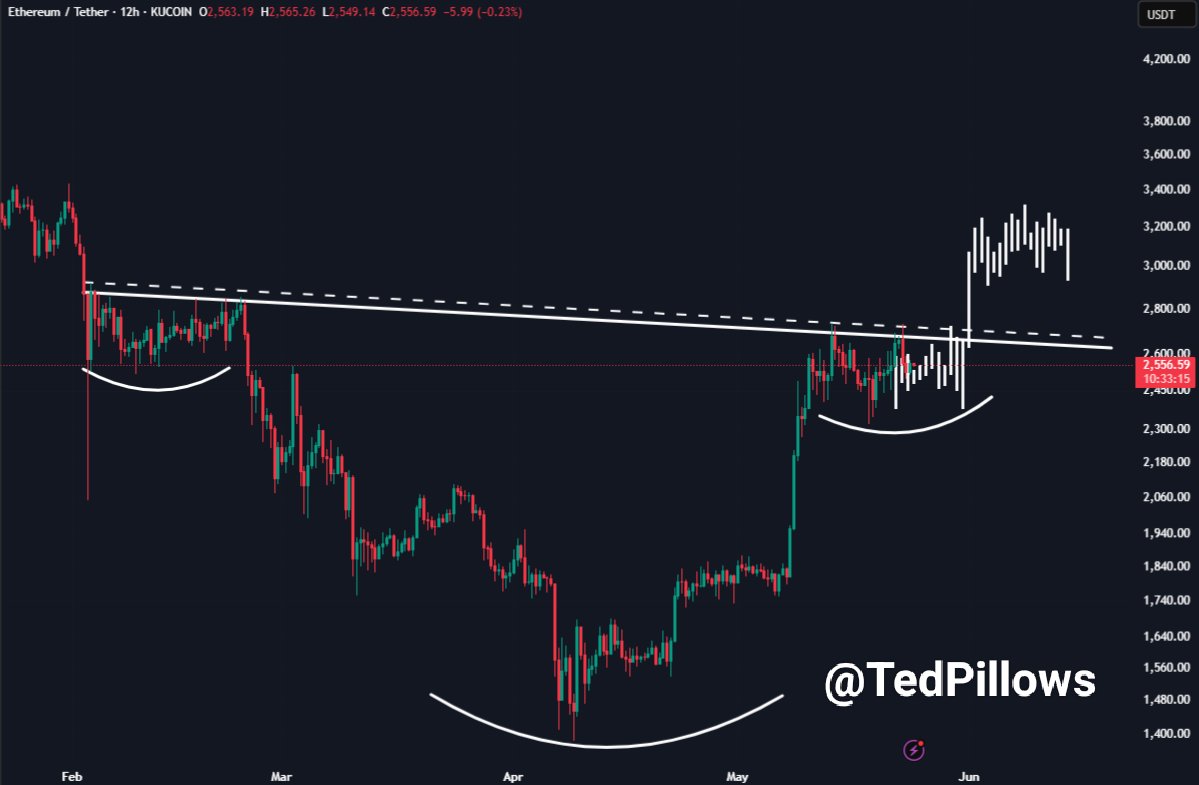
Top analyst Ted Pillows added to the discussion by highlighting data from Coinglass , which shows significant liquidity sitting around the $105,700 level on the BTC weekly liquidation heatmap. According to Pillows, this cluster could serve as a short-term magnet, suggesting that a quick sweep of that zone may occur before Bitcoin resumes its upward move.

“Liquidity at $105K is thick. A dip into that area could clear out late longs before the next leg higher,” he noted.
With Bitcoin holding key levels and sentiment remaining grounded, the setup is favorable for continuation, but not without potential volatility. If BTC can defend the $100K–$105K range and reclaim $110K, the next push toward new highs may arrive sooner than expected. For now, bulls remain in control, but traders are staying alert as global markets remain on edge.
BTC Holds Above Key Averages
Bitcoin is trading at $108,249 on the 4-hour chart after a strong push to $112,000 earlier in the week. The chart shows BTC currently consolidating above a confluence of key moving averages, including the 34 EMA ($108,046), 50 SMA ($106,840), and 100 SMA ($105,109), all of which are trending upward. These levels now serve as dynamic support zones, keeping the short-term structure bullish as long as price remains above them.
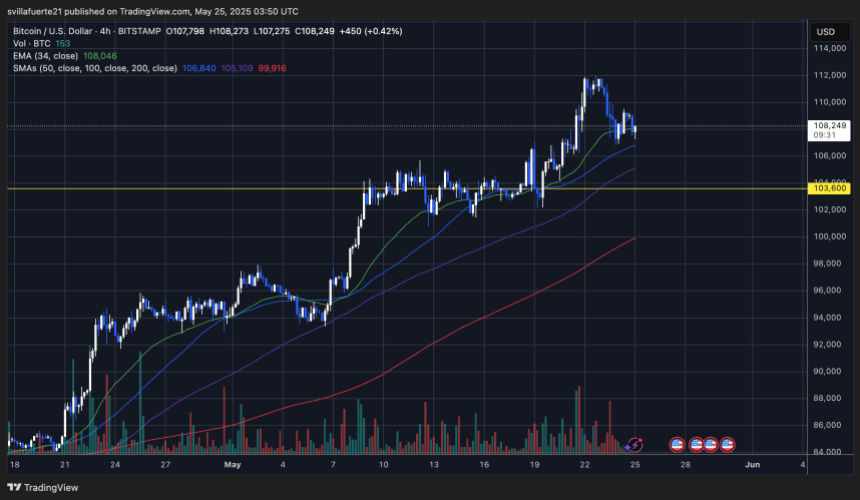
Despite the rejection near $112K, BTC has avoided any aggressive selloff and continues to respect the mid-range levels of its recent breakout. The $103,600 level, marked in yellow, is a key horizontal support and previously acted as a resistance ceiling. It now provides a strong base if any deeper correction occurs.
Volume has declined during this pullback phase, indicating that the selling pressure is likely corrective rather than the start of a trend reversal. If bulls can maintain control above $106K and reclaim momentum above $110K, a retest of the recent highs is likely.
For now, the 4-hour trend remains intact. All eyes are on whether Bitcoin can hold above the clustered support and continue building a base for the next leg higher.
Featured image from Dall-E, chart from TradingView
Ethereum Bullish Pattern Points To Immediate $3,000 Target – Details
The Ethereum market price rose by a net 3.16% in what proved to be another historic week for the cry...

Bitcoin At Crossroads After Trump Tariff Shock: Breakdown Towards $106K Or New ATH?
Bitcoin is grappling with intensified volatility following a sharp selloff triggered by US President...
Bitcoin Short-Term Holders Are Distributing Again — Local Price Top Imminent?
After an impressive outing in the past week, the price of Bitcoin seems to be in a cool-off period, ...