XRP Price Breaks Key Resistance Level, Eyes Fresh Upside Momentum


XRP price found support at $2.080 and started a fresh increase. The price is now gaining pace and might clear the $2.150 resistance zone.
- XRP price started a recovery wave above the $2.10 zone.
- The price is now trading above $2.120 and the 100-hourly Simple Moving Average.
- There was a break above a key bearish trend line with resistance near $2.1450 on the hourly chart of the XRP/USD pair (data source from Kraken).
- The pair might start another increase if there is a close above the $2.1680 resistance.
XRP Price Eyes More Gains
XRP price remained supported above the $2.080 level and started a fresh recovery wave, like Bitcoin and Ethereum . The price was able to surpass the $2.10 and $2.120 levels.
There was a break above a key bearish trend line with resistance near $2.1450 on the hourly chart of the XRP/USD pair. The bulls pushed the price above the 23.6% Fib retracement level of the downward move from the $2.2580 swing high to the $2.078 low.
The price is now trading above $2.150 and the 100-hourly Simple Moving Average. On the upside, the price might face resistance near the $2.1680 level and the 50% Fib retracement level of the downward move from the $2.2580 swing high to the $2.078 low.
The first major resistance is near the $2.180 level. The next resistance is $2.20. A clear move above the $2.20 resistance might send the price toward the $2.220 resistance. Any more gains might send the price toward the $2.250 resistance or even $2.30 in the near term. The next major hurdle for the bulls might be $2.320.
Another Decline?
If XRP fails to clear the $2.180 resistance zone, it could start another decline. Initial support on the downside is near the $2.1320 level. The next major support is near the $2.120 level.
If there is a downside break and a close below the $2.120 level, the price might continue to decline toward the $2.080 support. The next major support sits near the $2.050 zone.
Technical Indicators
Hourly MACD – The MACD for XRP/USD is now gaining pace in the bullish zone.
Hourly RSI (Relative Strength Index) – The RSI for XRP/USD is now above the 50 level.
Major Support Levels – $2.120 and $2.080.
Major Resistance Levels – $2.180 and $2.20.

Stripe Integrates Stablecoins and AI Technology – Will AI Agent Coins Like $MIND Benefit?
Stripe, the global payment solution provider, has launched Stablecoin Financial Accounts. It’s a new...
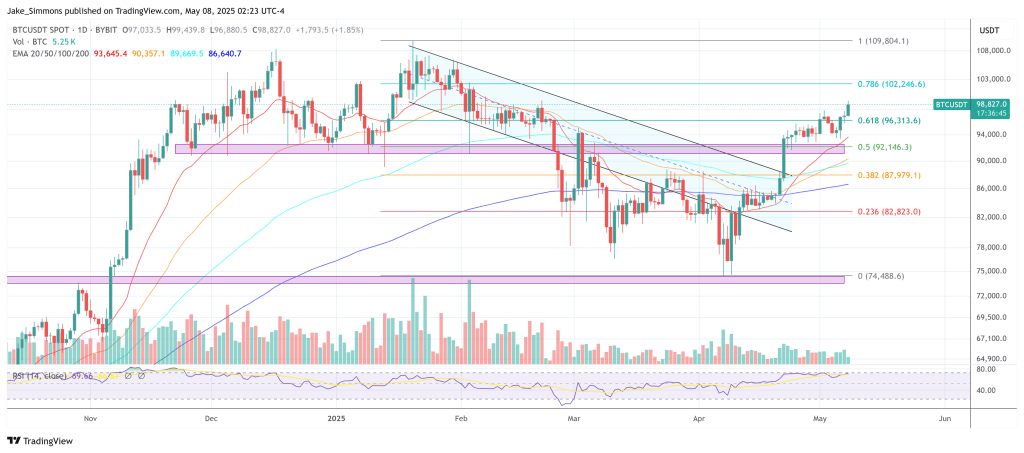
Bitcoin Soars Toward $100,000 As Treasury, Not Fed, Drives Liquidity: Expert
Arthur Hayes, the co-founder of BitMEX and principal of Maelstrom Capital, contends that the US Trea...
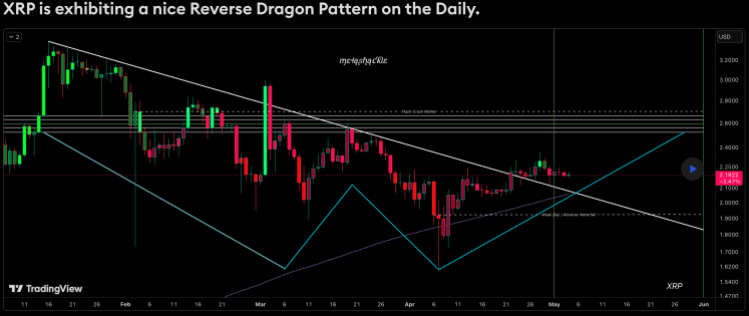
XRP Is Forms Bullish Reverse Dragon Head Pattern, How High Can Price Go?
The XRP price is once again showing bullishness, even after the altcoin has been plagued by dips. Th...