Dogecoin (DOGE) Fights to Stay Afloat — Major Hurdles Remain


Dogecoin started a fresh decline from the $0.1900 zone against the US Dollar. DOGE is now correcting losses and might find face hurdles near $0.1750.
- DOGE price failed to clear $0.200 and corrected gains.
- The price is trading below the $0.180 level and the 100-hourly simple moving average.
- There is a key bearish trend line forming with resistance at $0.1740 on the hourly chart of the DOGE/USD pair (data source from Kraken).
- The price could start a fresh increase if it clears the $0.1800 resistance zone.
Dogecoin Price Eyes Recovery
Dogecoin price started a fresh increase above the $0.1650 resistance, like Bitcoin and Ethereum . DOGE climbed above the $0.1720 and $0.1750 resistance levels before the bears appeared.
A high was formed at $0.1920 and the price started a fresh decline. There was a move below the $0.180 and $0.1750 levels. A low was formed at $0.1671 and the price is now attempting a recovery wave. It surpassed the 50% Fib retracement level of the downward move from the $0.1807 swing high to the $0.1671 low.
Dogecoin price is now trading below the $0.180 level and the 100-hourly simple moving average. Immediate resistance on the upside is near the $0.1750 level. There is also a key bearish trend line forming with resistance at $0.1740 on the hourly chart of the DOGE/USD pair.
The trend line is near the 61.8% Fib retracement level of the downward move from the $0.1807 swing high to the $0.1671 low. The first major resistance for the bulls could be near the $0.1840 level.
The next major resistance is near the $0.1850 level. A close above the $0.1850 resistance might send the price toward the $0.1920 resistance. Any more gains might send the price toward the $0.1980 level. The next major stop for the bulls might be $0.200.
Another Decline In DOGE?
If DOGE’s price fails to climb above the $0.1750 level, it could start another decline. Initial support on the downside is near the $0.170 level. The next major support is near the $0.1680 level.
The main support sits at $0.1600. If there is a downside break below the $0.160 support, the price could decline further. In the stated case, the price might decline toward the $0.1550 level or even $0.1450 in the near term.
Technical Indicators
Hourly MACD – The MACD for DOGE/USD is now losing momentum in the bearish zone.
Hourly RSI (Relative Strength Index) – The RSI for DOGE/USD is now above the 50 level.
Major Support Levels – $0.1700 and $0.1680.
Major Resistance Levels – $0.1750 and $0.1840.
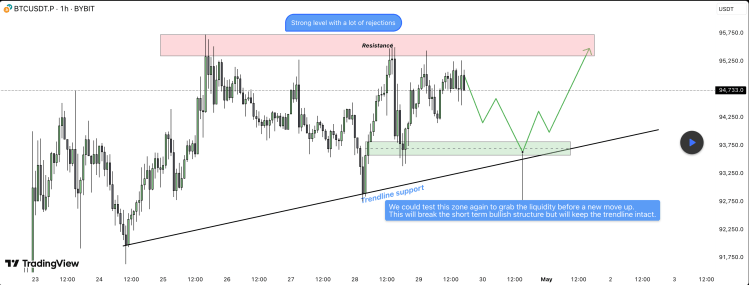
Bitcoin Price To Break Key Resistance For Rally With A Crash To This Zone First
The Bitcoin price seems to have hit an important make it or break it point that will determine the n...
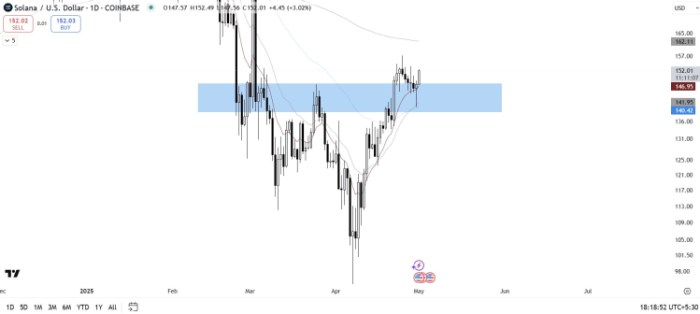
Best Altcoins on Solana to Explode as Investor Interest in $SOL ETF Skyrockets
According to Bloomberg Intelligence, the likelihood of US regulators approving a Solana ETF (exchang...
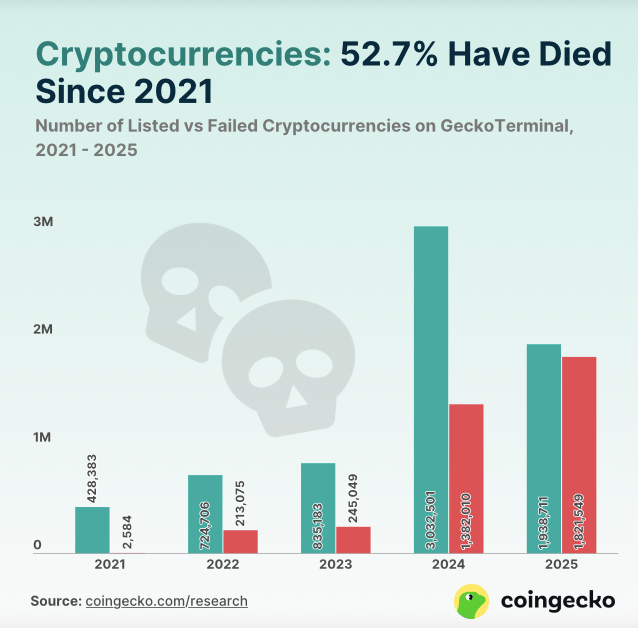
Crypto Graveyard: 50% Of Tokens Have Failed In the Past 5 years – Report
A recent report revealed that over 50% of all crypto tokens have failed in the past five years, with...