Bitcoin–S&P 500 Correlation Hits 80%, Tying Crypto To Stocks


Bitcoin is trading around key levels after reclaiming the $115,000 mark, with bulls firmly in control despite ongoing consolidation below the $120,000 threshold. The trend remains bullish, supported by steady buying interest and strong technical positioning.
Key data shows that the correlation between Bitcoin and the S&P 500 has surged to 80%. In this high-correlation regime, a continued rally in US equities could provide Bitcoin with a tailwind toward new highs, while an equity pullback could amplify downside volatility.
With the S&P 500 currently in a bullish phase, BTC appears to be tracking the same trajectory. Still, market watchers caution that such high correlation levels are often short-lived and prone to sharp reversals. For now, traders are closely monitoring both equity and crypto charts , knowing that any shift in risk appetite across traditional markets could quickly ripple into Bitcoin’s price action.
S&P 500 Correlation Strengthens Bitcoin’s Macro Link
According to top analyst Axel Adler, the recent 80% correlation between Bitcoin and the S&P 500 underscores how deeply macroeconomic forces are influencing the crypto market. In this environment, key drivers such as interest rate expectations, liquidity conditions, and the broader risk-on/risk-off sentiment are directly transmitted to BTC’s price action.
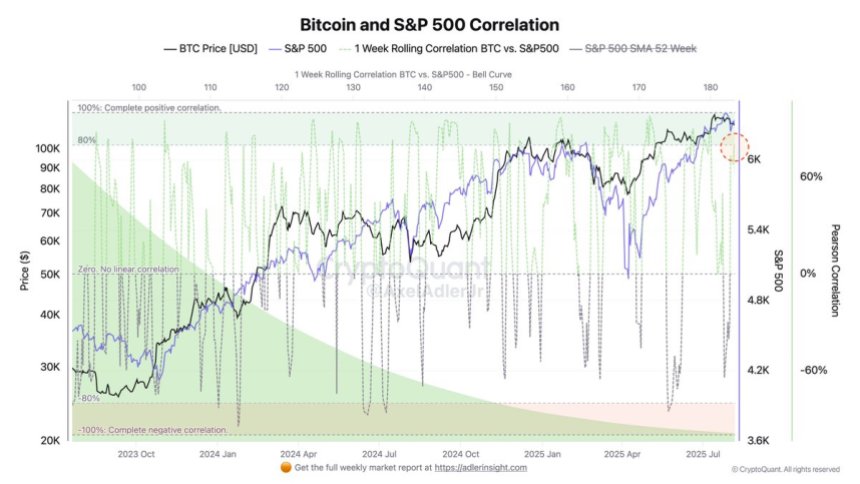
Under this regime, a sustained recovery in US equities will likely provide a supportive backdrop for Bitcoin. Conversely, if stock markets experience a downturn, the negative sentiment could quickly spill over into the crypto space, amplifying sell-offs and triggering broader market weakness.
Adler points out that the current reading is based on a 1-week rolling correlation metric, which is inherently volatile. Historically, such correlation spikes are rarely sustained for long periods. The present level, while significant, is unlikely to hold for more than a few weeks before reverting toward its mean.
Despite the short-term nature of this spike, the analyst emphasizes that the growth of crypto adoption in the US—from institutional products like ETFs to corporate treasury allocations—sets the stage for a bullish long-term outlook. Still, traders must remain mindful that macroeconomic downturns, tightening liquidity, or shifts in Federal Reserve policy could rapidly reverse market sentiment.
Bitcoin Price Analysis: Bulls Defend Key Support
Bitcoin (BTC) is trading around $116,565, holding steady after reclaiming the $115,724 support level, which coincides with a key horizontal zone from late July. On the 4-hour chart, BTC recently broke above the 50-day, 100-day, and 200-day SMAs, signaling short-term bullish momentum. These moving averages, now converging near $116,000, could act as a strong support cluster if tested again.
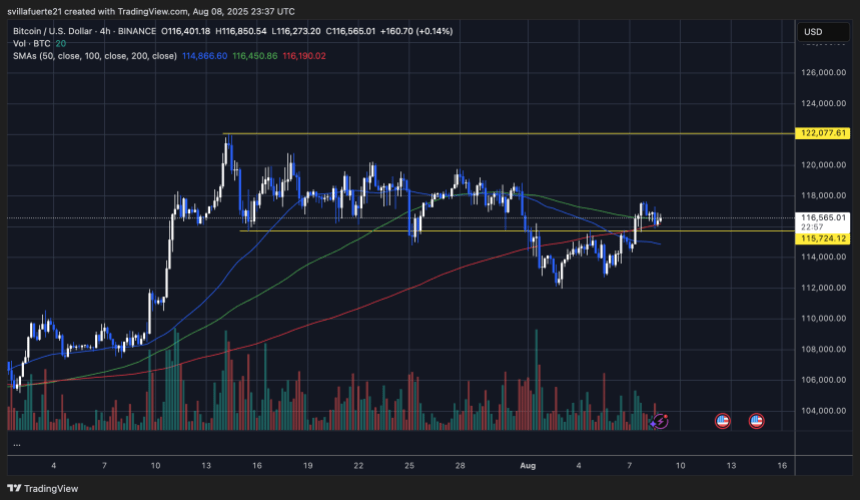
The immediate upside target remains the $122,077 resistance, last tested in mid-July. However, BTC has faced selling pressure near $117,000, indicating short-term consolidation before a possible push higher. Volume has tapered slightly after the breakout, suggesting that buyers may need fresh momentum to sustain the move.
If BTC holds above $115,724 and the moving average cluster, bulls could attempt a breakout toward the $118,000–$122,000 zone. However, rejection might trigger a retest of $115,724, with a deeper pullback.
Featured image from Dall-E, chart from TradingView
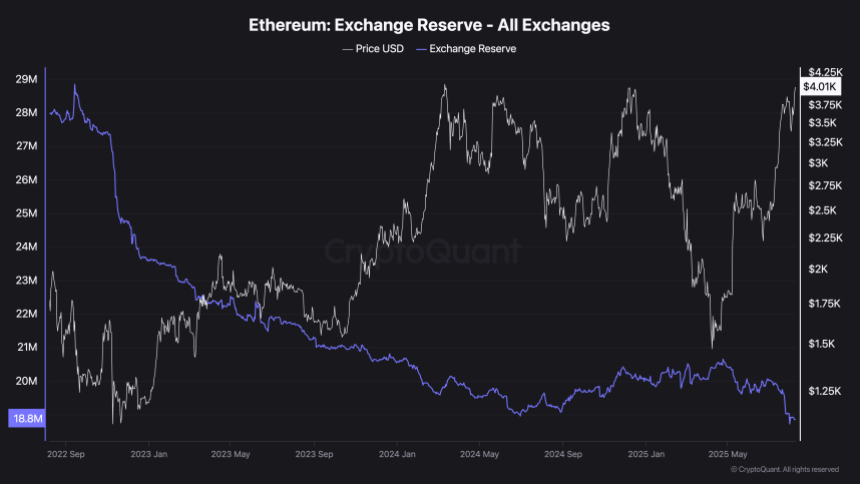
Ethereum Exchange Balances Decline To 18.8M ETH: Smart Money Drains Supply
Ethereum (ETH) has surged above the $4,000 mark for the first time since last December, signaling a ...

XRP Still Has A Shot If It Can Hold This Level
After a near steady decline over the last week, the XRP price is now struggling as it fluctuates bet...

Exit Scam? DeFi Protocol CrediX’s Team Vanishes Following $4.5 Million Exploit
The team behind the DeFi protocol CrediX is suspected of an exit scam following a recent $4.5 millio...