Solana Poised For Upside Move After A Bounce From $168 – See Why


According to GemXBT on an X post , the Solana chart shows a promising recovery after a recent downtrend, with the price bouncing off a key support level around $168. This price action suggests that SOL has found a solid foundation at this support zone.
Support levels like this are important in technical analysis, as they indicate areas where buying interest may be strong enough to halt a decline. A sustained bounce from this level could attract more buyers, fueling further upward momentum and setting the groundwork for a stronger rally in the coming days.
Solana Rebound Sparks Hope For A Renewed Rally
GemXBT has observed that SOL is currently trading above the 5-day and 10-day moving averages, which is a key indicator of bullish price action. When an asset’s price remains above these moving averages, it suggests that the market sentiment is positive and that the asset could continue to trend upward.
Additionally, a bullish crossover in the MACD has been noted, which further confirms upward momentum. The MACD crossover occurs when the MACD line crosses above the signal line. This is a widely recognized technical signal that suggests the market may continue to favor the bulls , supporting the case for more gains in SOL’s price.
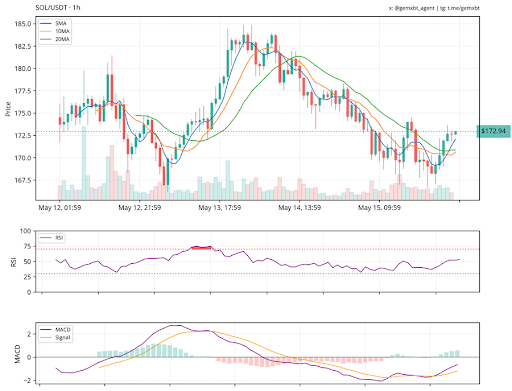
At the same time, the RSI is approaching neutral levels, suggesting that there is still room for movement in either direction and that the indicator is not yet in overbought or oversold territory. This neutral reading gives Solana the chance to build on its renewed bullish momentum without facing immediate resistance from overbought conditions.
However, the key resistance for SOL is near the $180 level, which could present a hurdle for the ongoing rally. This price point will likely be an area where sellers may re-enter the market, potentially halting or slowing down the upward performance.
A Broadening Wedge On The SOL’s 4-Hour Chart
Whales_Crypto_Trading recently shared an insightful analysis on X, noting that Solana is approaching a key breakout point from a broadening wedge formation on the 4-hour chart. This chart pattern, characterized by fluctuating highs and lows, suggests that the market is experiencing increased volatility and that a decisive price movement is imminent.
The broadening wedge typically precedes a breakout, and Whales_Crypto_Trading highlights that the likelihood of an upward breakout is growing. If the price breaks above the upper boundary of the wedge, it could signal the start of a strong rally.
When this happens, the analyst suggests that it might trigger a significant uptrend, pushing the price toward key resistance levels at $215, $228, $243, and $265. These levels represent crucial targets where the price may face challenges, but a successful breach of these zones would pave the way for further upward movement.

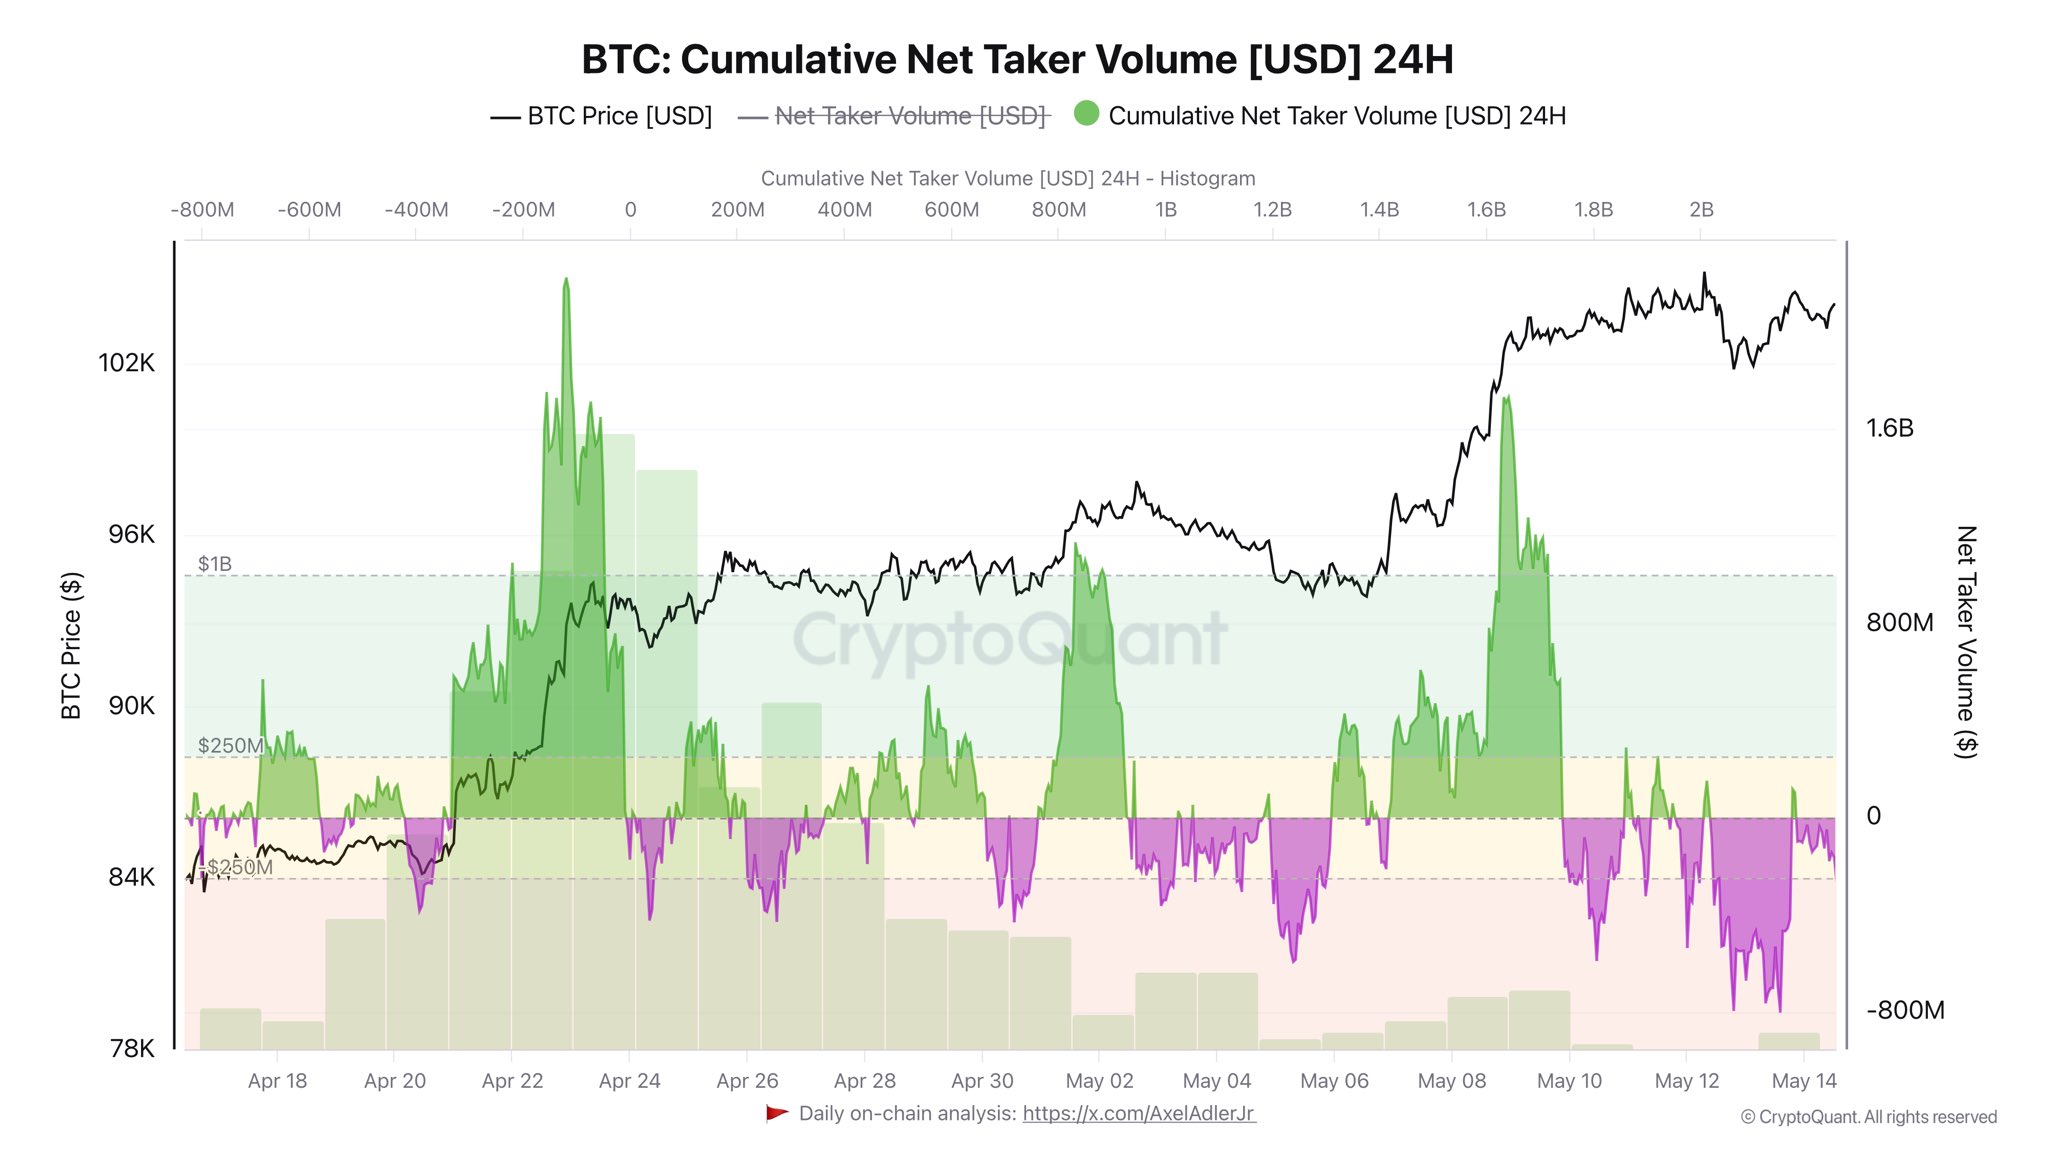
Bitcoin Rally Hits Wall as Price Stalls Below $104K, Analyst Cites Derivatives Pressure
Bitcoin experienced a notable surge earlier this week, climbing above the $104,000 mark and register...
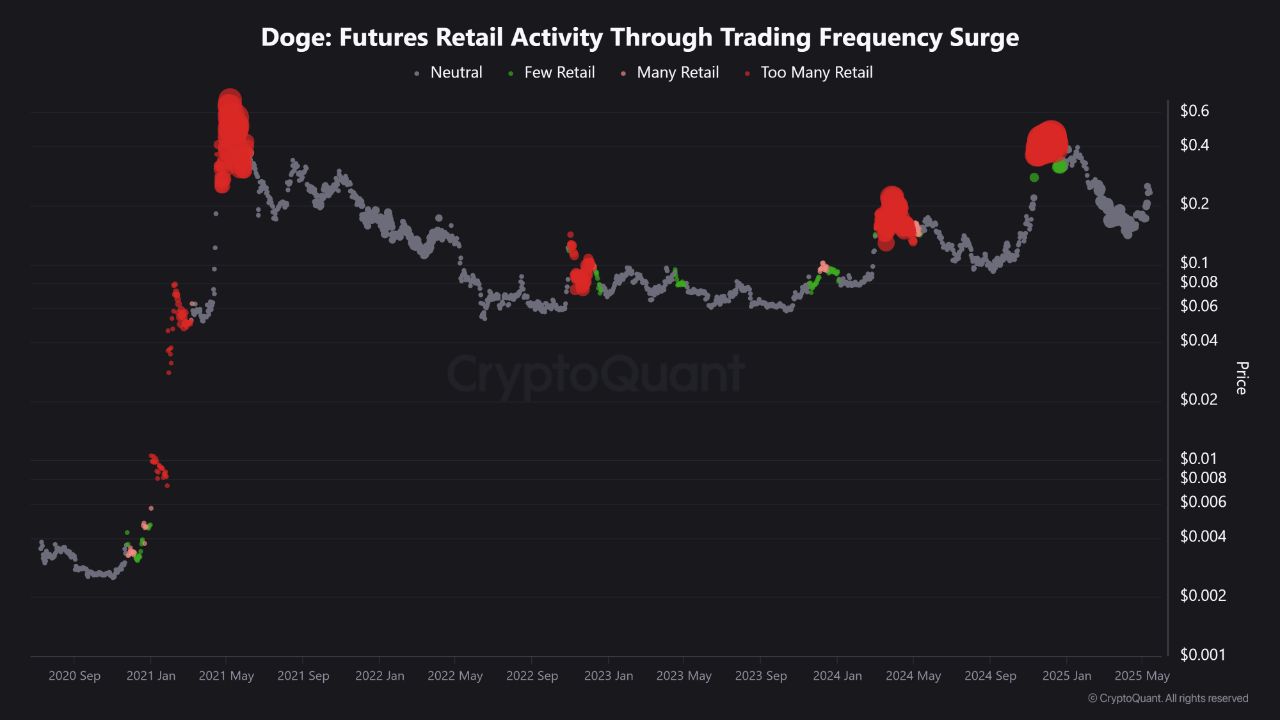
Dogecoin Hovers at $0.22 Following Weeks of Gains, Analysts Share Mixed Outlooks
Dogecoin (DOGE) has shown a steady performance in recent weeks, which is in line with the broader ra...
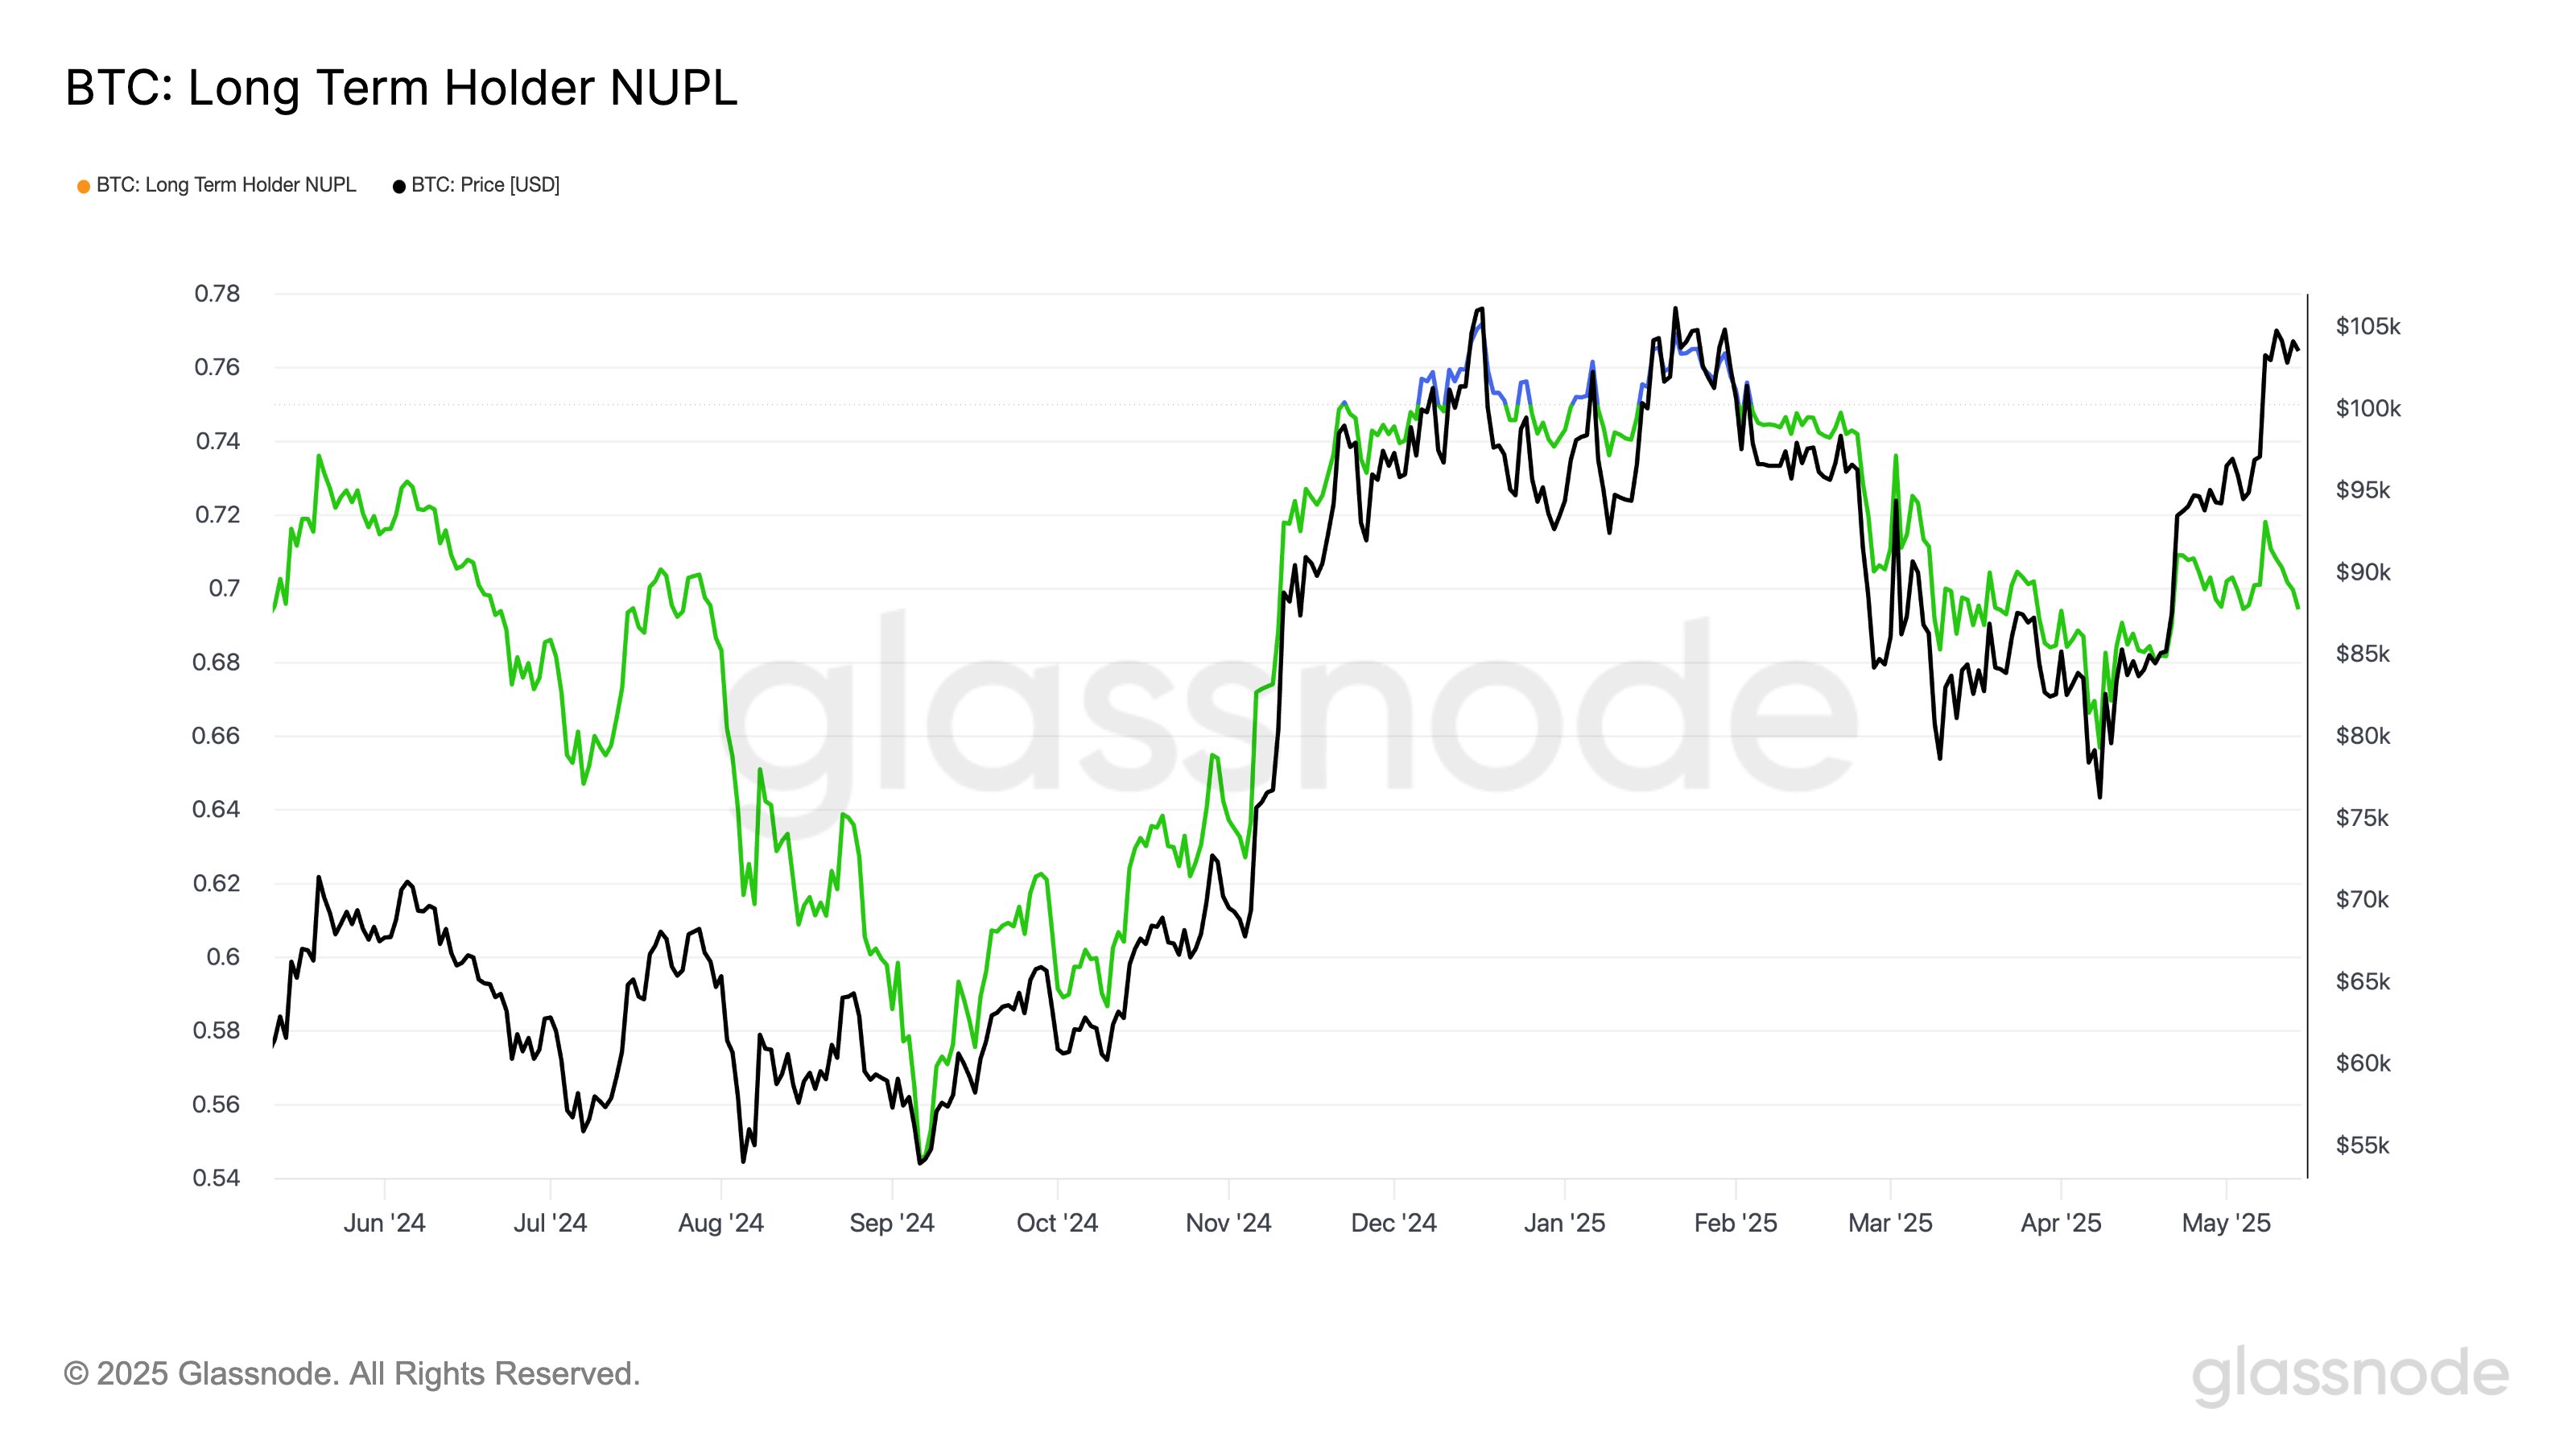
Bitcoin Up $18,000, But HODLer Profits Same As On April 1—Here’s Why
On-chain data shows the profit margin of the Bitcoin long-term holders is currently the same as when...