Bitcoin Price Looks Upward — Is the Next Leg Higher Starting?


Bitcoin price started a fresh increase and cleared the $103,500 zone. BTC is now consolidating and might aim to clear the $105,000 zone.
- Bitcoin started a fresh upward move from the $101,500 zone.
- The price is trading above $103,000 and the 100 hourly Simple moving average.
- There was a break above a connecting bearish trend line with resistance at $103,950 on the hourly chart of the BTC/USD pair (data feed from Kraken).
- The pair could gain bullish momentum if it clears the $105,000 resistance.
Bitcoin Price Aims Higher
Bitcoin price started a fresh increase from the $101,500 support zone . BTC formed a base and was able to clear the $102,500 resistance zone. The bulls even pushed the price above $103,200.
There was a move above the 50% Fib retracement level of the downward move from the $104,980 swing high to the $101,441 low. Besides, there was a break above a connecting bearish trend line with resistance at $103,950 on the hourly chart of the BTC/USD pair.
Bitcoin is now trading above $103,200 and the 100 hourly Simple moving average . On the upside, immediate resistance is near the $104,150 level or the 76.4% Fib retracement level of the downward move from the $104,980 swing high to the $101,441 low.
The first key resistance is near the $105,000 level. The next key resistance could be $105,500. A close above the $105,500 resistance might send the price further higher. In the stated case, the price could rise and test the $106,500 resistance level. Any more gains might send the price toward the $108,000 level.
Another Decline In BTC?
If Bitcoin fails to rise above the $104,200 resistance zone, it could start another correction in the short term. Immediate support on the downside is near the $103,200 level and the 100 hourly Simple moving average. The first major support is near the $102,500 level.
The next support is now near the $101,500 zone. Any more losses might send the price toward the $100,000 support in the near term. The main support sits at $98,800, below which BTC might gain bearish momentum.
Technical indicators:
Hourly MACD – The MACD is now gaining pace in the bullish zone.
Hourly RSI (Relative Strength Index) – The RSI for BTC/USD is now above the 50 level.
Major Support Levels – $102,500, followed by $101,500.
Major Resistance Levels – $104,200 and $105,000.

Bitcoin Rally Stalls as SOPR Spikes: Analyst Explains What It Means
Bitcoin’s recent climb appears to have momentarily slowed following a period of consistent upward mo...
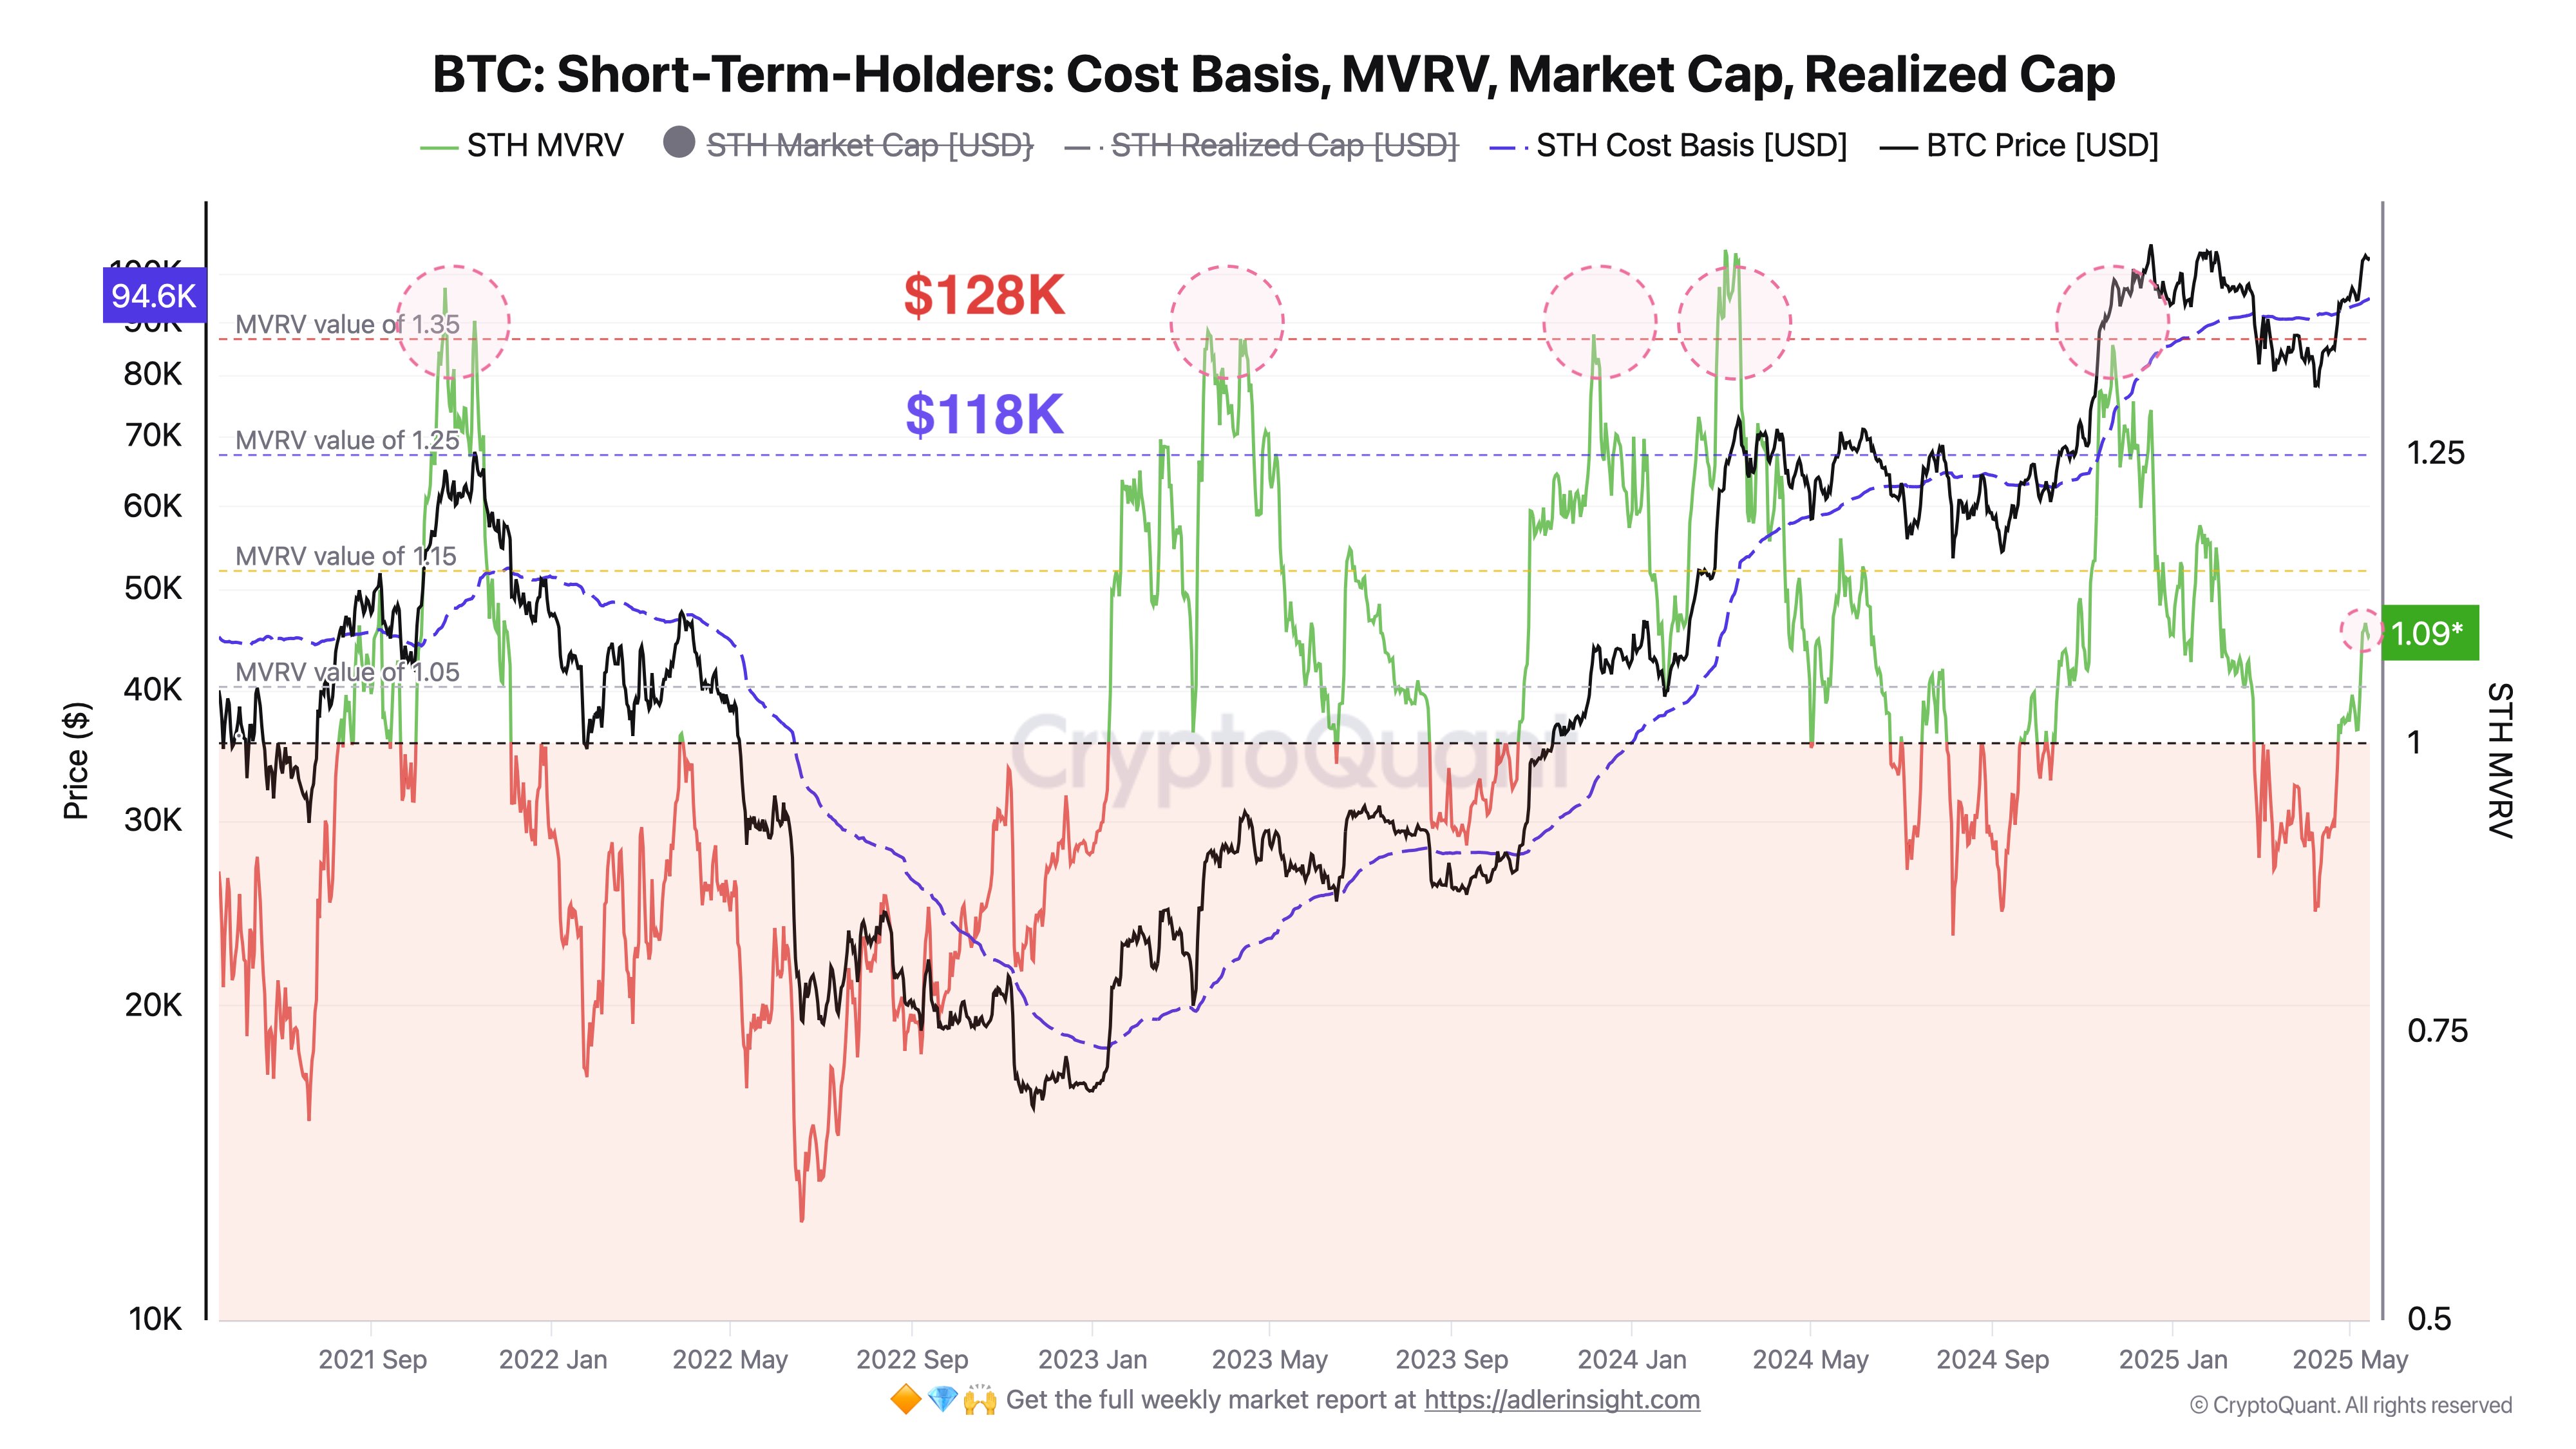
Bitcoin Could See Short-Term Holder Selloff Around These Levels, Analyst Says
An analyst has explained how Bitcoin could face significant waves of selling pressure from the short...

Ethereum Breaks Above Key Realized Price Zones—What It Means for ETH
Ethereum (ETH) experienced a slight price pullback over the past 24 hours, declining by 2.1% to hove...