Buyers Take Control: Indicator That Predicted Previous Bitcoin Rallies Fires Again


Bitcoin has been able to climb above the $104,000 level, following a notable double-digit increase over the past week. At the time of writing, BTC trades at $104,271, narrowing the gap to its all-time high of $109,000.
This recent price surge is not occurring in isolation. Instead, it appears closely tied to broader macroeconomic developments, most notably, the recent easing of trade tensions between the US and China , with both countries reducing tariffs on certain imports and exports.
Market participants have responded positively to these policy shifts, signaling renewed risk appetite across traditional and digital asset markets.
Bitcoin’s rally over the weekend reflects this optimism , with analysts identifying key technical indicators pointing toward rising buyer strength. One such indicator, the Taker Buy Sell Ratio, is gaining attention for marking previous turning points in Bitcoin’s price history.
Bitcoin Taker Buy-Sell Ratio Signals Renewed Bullish Control
CryptoQuant contributor G a a h highlighted that the Taker Buy Sell Ratio, a metric measuring the ratio of market buy orders to sell orders, has climbed to a significant threshold of 1.02. Historically, similar levels have coincided with crucial inflection points in Bitcoin’s price movement.

For instance, this metric reached comparable highs during the late 2022 lows between $15,000 and $20,000, and again in October 2023 as Bitcoin broke through the $30,000 resistance level.
According to G a a h, this recent breakout above the 1.00 line reflects an increase in aggressive buying activity, with market takers once again asserting short-term control . This suggests upward momentum may persist in the near term.
However, the analyst also cautioned that these same conditions have previously been followed by volatility spikes, marking both the start and reversal of market trends. The analyst wrote:
It’s worth noting that in previous periods, this same level has coincided with reversal zones or strong volatility, marking both the start and end of trends. We are therefore facing a scenario where buyer appetite could continue to drive BTC towards new highs.
Realized Price Trends Confirm Ongoing Market Strength
In a separate analysis , CryptoQuant analyst Crypto Dan examined Bitcoin’s realized price, a metric that reflects the average purchase price of all circulating BTC, as a tool to gauge market sentiment and directional strength.

According to the report, the realized price is still on the rise, indicating that investors are increasingly accumulating BTC at higher prices. This trend differs significantly from previous cycles, where a reversal in the realized price preceded steep corrections.
Crypto Dan attributes the current rise to institutional inflows, particularly through spot Bitcoin ETFs and corporate balance sheet purchases. These channels have brought in sustained capital, elevating the average acquisition price and reinforcing market structure .
As institutional players continue to allocate capital into Bitcoin, the realized price trend suggests that the ongoing rally may have more room to extend. With macroeconomic support from tariff reductions and on-chain indicators flashing green, the broader setup remains constructive for Bitcoin’s continued strength in the near term.

Featured image created with DALL-E, Chart from TradingView
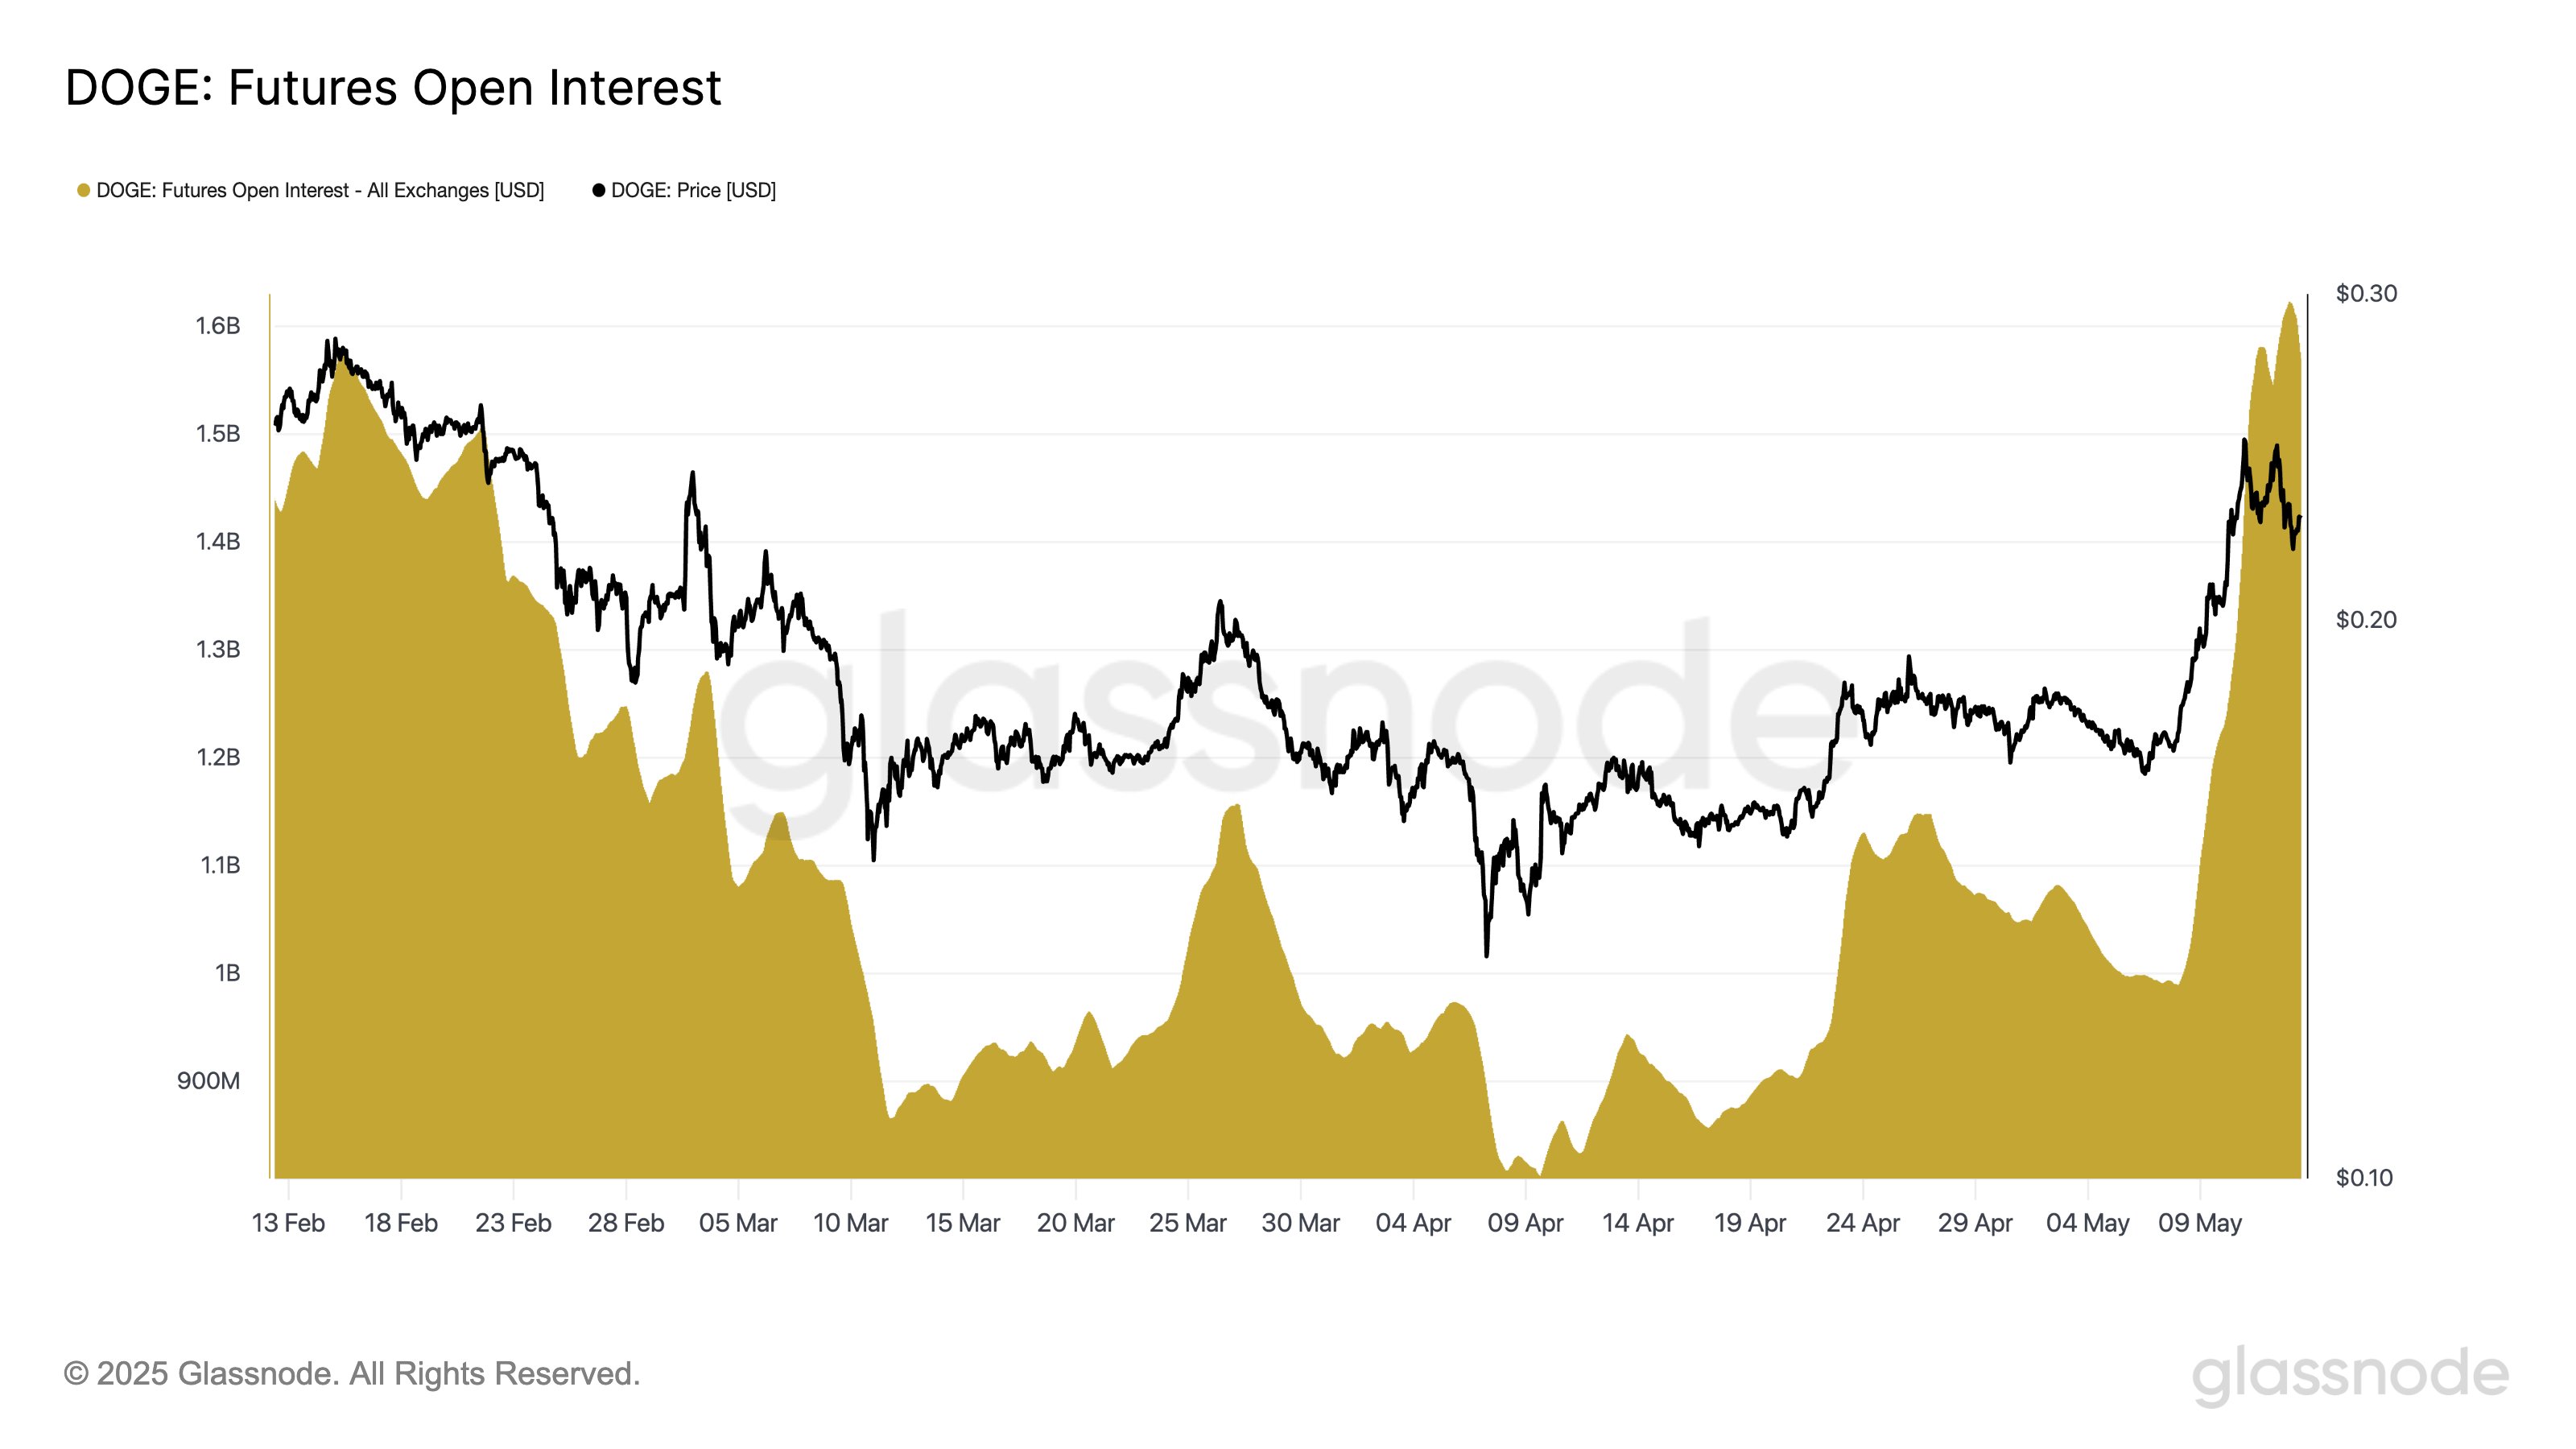
Dogecoin Open Interest Up Despite Price Pullback, Data Shows
Data shows the Dogecoin Futures Open Interest has continued to rise, a sign that the price pullback ...
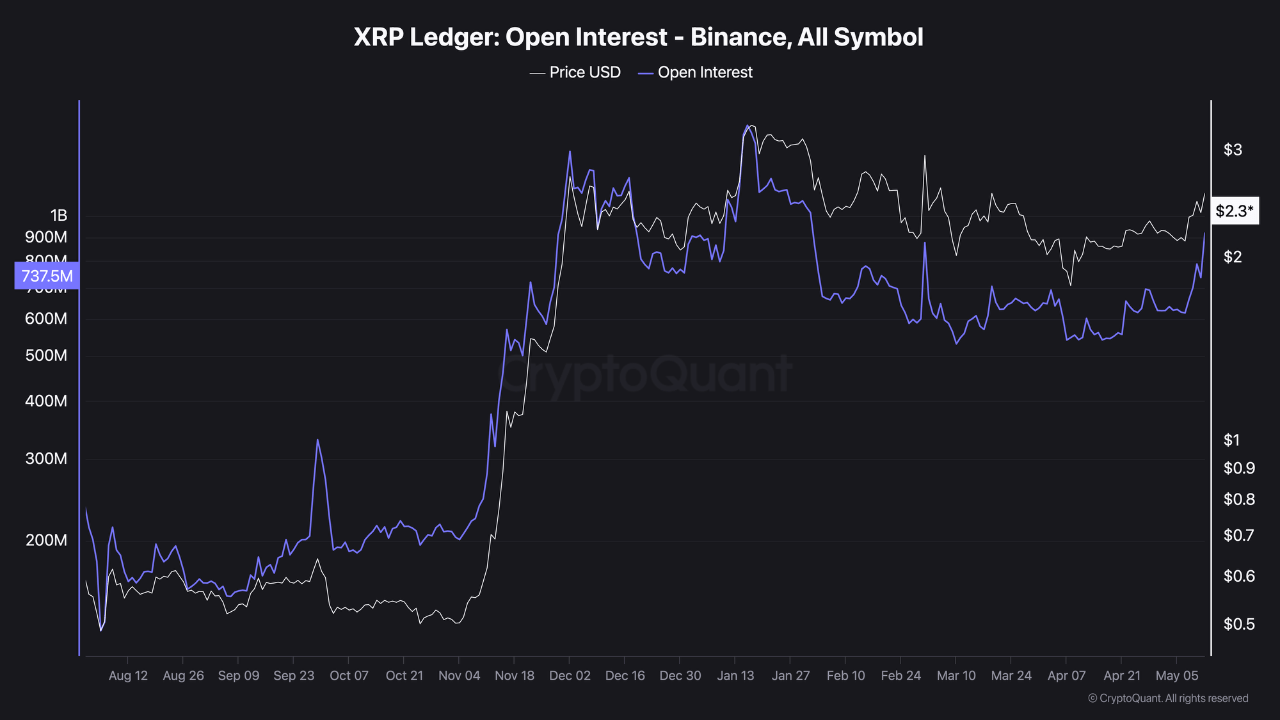
XRP Sees Renewed Trader Activity as Market Absorbs Selling Pressure
XRP has aligned itself with the broader cryptocurrency market’s upward trend, registering significan...
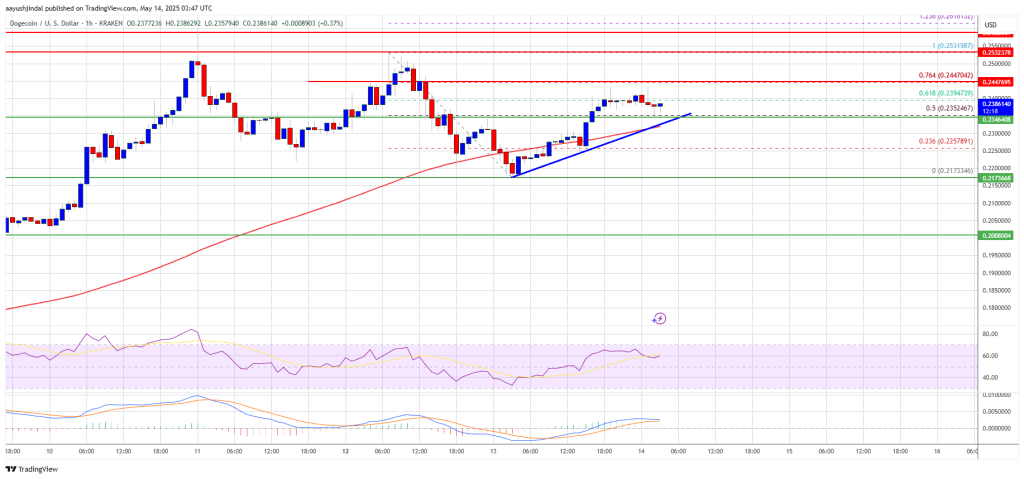
Dogecoin (DOGE) Gears Up for Next Leg Higher — Will Resistance Break?
Dogecoin started a fresh increase from the $0.220 zone against the US Dollar. DOGE is now gaining pa...