The post Stablecoin Inflows Jump From $51B to $102B—Is Smart Money Preparing to Buy the Dip? appeared first on Coinpedia Fintech News
The crypto market has come under intense selling pressure, with more than $350 billion wiped off total market capitalization. Similar downturns in the past have usually been accompanied by falling participation and capital exiting the space. This time, however, the setup looks different.
Instead of drying up, capital has surged, with stablecoin inflows doubling even as prices decline. This points to traders staying engaged and waiting on the sidelines rather than rushing to exit, likely positioning for a potential entry near market lows.
The key question now is whether the Bitcoin (BTC) price has already found a bottom or if the market still needs to endure further downside before a more durable recovery can take shape.
Stablecoin Inflow Doubles to OVer $102 Billion
The Weekly stablecoin exchange inflows have witnessed a massive increase, nearly doubling, highlighting a sharp increase in funds moving into exchanges during the sell-off. The rise in the stablecoin inflow comes at a time when Bitcoin and major altcoins remain under pressure, weighed down by heavy liquidations and weakening short-term market structure.
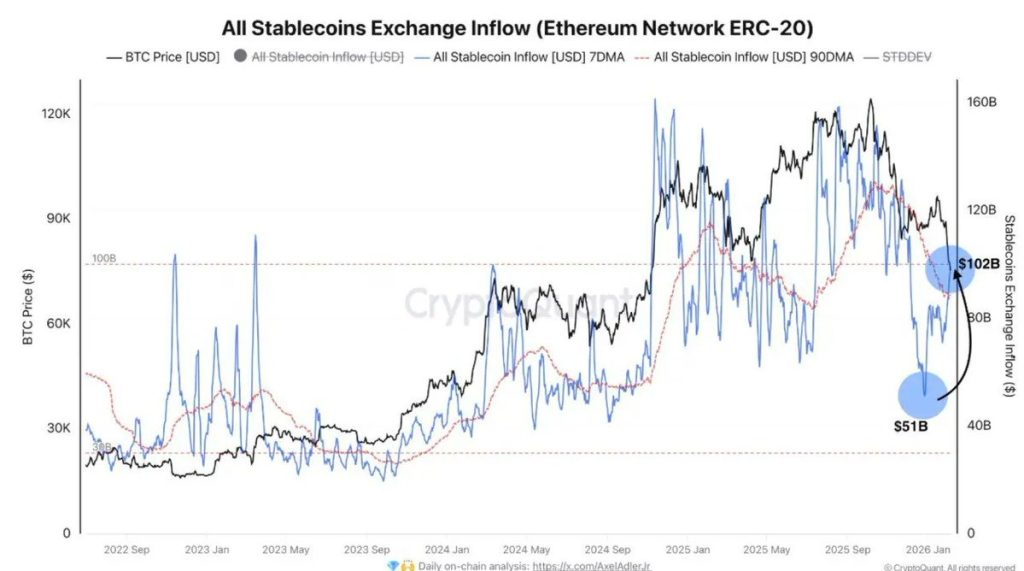
The data from CryptoQuant shows a major spike in inflows reaching $102 billion, well above the 90-day average of around $89 billion. This increase indicates a rapid rise in stablecoins being transferred to exchanges rather than withdrawn. Large inflows during a sell-off usually indicate that traders are preparing for potential accumulation rather than exiting the market. In simple terms, they are waiting for the markets to bottom.
When Does the Crypto Market Typically Bottom?
Historical Bitcoin bear markets show a clear pattern in drawdowns. In past cycles—2011, 2013–15, 2017–18, and 2021–22—market bottoms have usually formed after Bitcoin recorded deep peak-to-trough losses ranging between 60% and 80%.
The chart highlights that earlier corrections rarely ended at shallow pullbacks. Instead, price tended to stabilize only after prolonged drawdowns, accompanied by sustained fear, declining participation, and extended consolidation phases. In the 2021–22 cycle, for example, Bitcoin bottomed only after the drawdown pushed well beyond 70%, followed by several months of sideways movement.
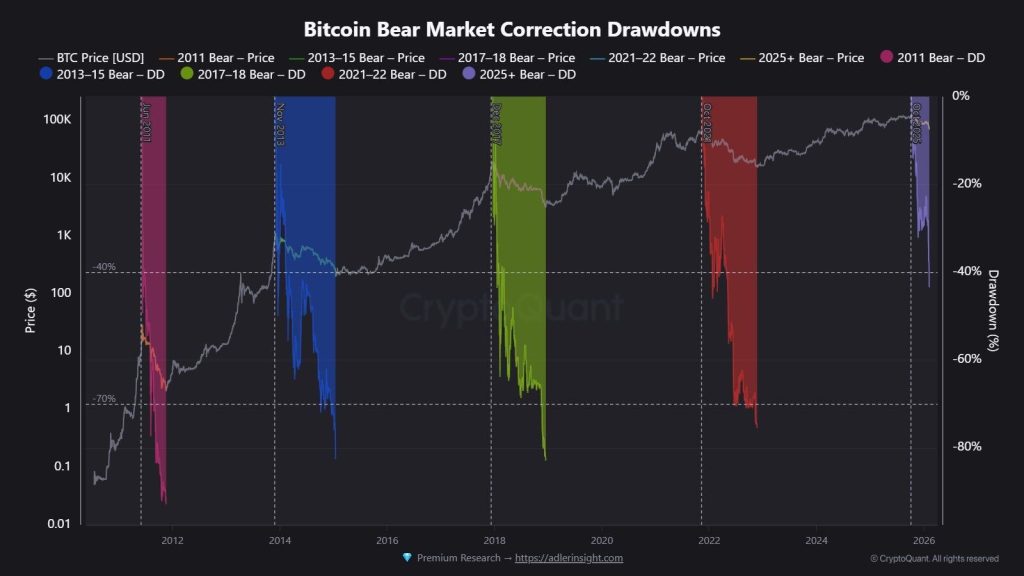
In the current cycle, the drawdown remains shallower compared to prior bear-market bottoms, suggesting the market may still be in a price-discovery and positioning phase rather than a confirmed bottoming process. Historically, bottoms have formed not at the first sharp drop, but after volatility compresses and drawdowns stop making new lows.
- Also Read :
- Crypto Market Crash: $380B Wiped Out as $2.6B Liquidations Push Bitcoin to $60K. What’s Next?
- ,
This comparison suggests that while capital positioning is increasing, time and further stabilization, rather than a single event, have typically been required before durable market bottoms emerge.
The Bottom Line: What to Watch Next?
The data suggests the market is not in panic exit mode, but it may also not be done correcting. More than $350 billion has already been erased from total crypto market capitalization, yet stablecoin inflows have doubled to around $102 billion, showing capital is waiting rather than leaving.
Historically, Bitcoin bear-market bottoms have formed after 60%–80% drawdowns. From the recent cycle high, BTC is currently down roughly 35%–45%, which places the market short of typical historical lows. Based on past drawdowns, a probable downside zone for the Bitcoin price lies between $48,000 and $42,000, where long-term demand has previously emerged.
For the broader crypto market, a comparable move would imply total market capitalization falling toward the $1.6 trillion–$1.4 trillion range, down from recent highs near $2.3 trillion.
In short, capital appears ready, but history suggests price may still need to probe lower levels or consolidate longerbefore a durable bottom is confirmed.
FAQs
Prices are falling due to liquidations, but stablecoin inflows suggest traders are staying active and preparing to buy, not exiting crypto.
They usually signal sidelined capital. Traders move funds to exchanges to prepare for buying near potential market bottoms.
Data suggests positioning, not panic. Capital is waiting on exchanges, indicating traders expect opportunities after volatility cools.