
The post Bitcoin Price Analysis: Rising Profit-Taking Signals More Volatility—What’s Next for BTC? appeared first on Coinpedia Fintech News
Bitcoin price is still trading in a profit-driven market, and that changes how the token moves. On-chain data shows more holders are selling at a profit than at a loss, which is typical in bullish phases, but it also adds supply during rallies. When profit-taking rises, Bitcoin often sees faster swings, failed breakouts, and sharper pullbacks before the trend resumes. With volatility building, the key question is whether buyers can absorb this selling pressure at major support zones and keep BTC’s uptrend intact.
Bitcoin Profit Taking is Back in Control
Bitcoin is showing a classic late-cycle behavior: holders are increasingly selling into strength. The Cryptoquant chart you shared tracks Bitcoin’s 1-year net realised profit and loss, which helps judge whether the market is dominated by profit-taking or capitulation. When the metric turns strongly positive, it usually signals a bullish environment, but it also means more supply appears on rallies as investors lock in gains. That mix often leads to sharper swings and higher volatility.
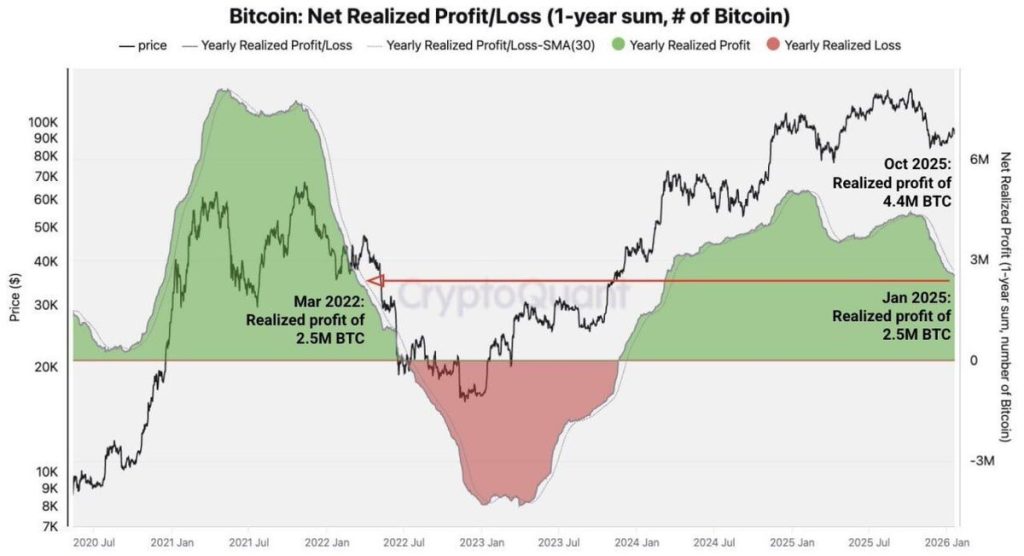
The chart is mostly green in the recent period, meaning net realised profits outweigh losses across the last year. After a loss-heavy phase in 2022–2023 (red), the shift back to profits reflects recovery and sustained demand. The rising green peaks into 2025 suggest profit-taking has intensified as prices moved higher. This is not automatically bearish, but it can cap upside and create pullbacks. Watch for green fading or red returning, which would signal stress.
Will BTC Price Reach $95,000?
Bitcoin is consolidating after a sharp sell-off, and the daily chart now shows a clear battle between dip-buyers and sellers at key levels. Price has been trading inside a rising channel, but recent candles suggest momentum is stalling near the midline. The chart also highlights multiple horizontal levels that traders are watching as potential breakout or breakdown triggers. With MACD flattening and CMF hovering near neutral, BTC looks set for a volatility expansion move.
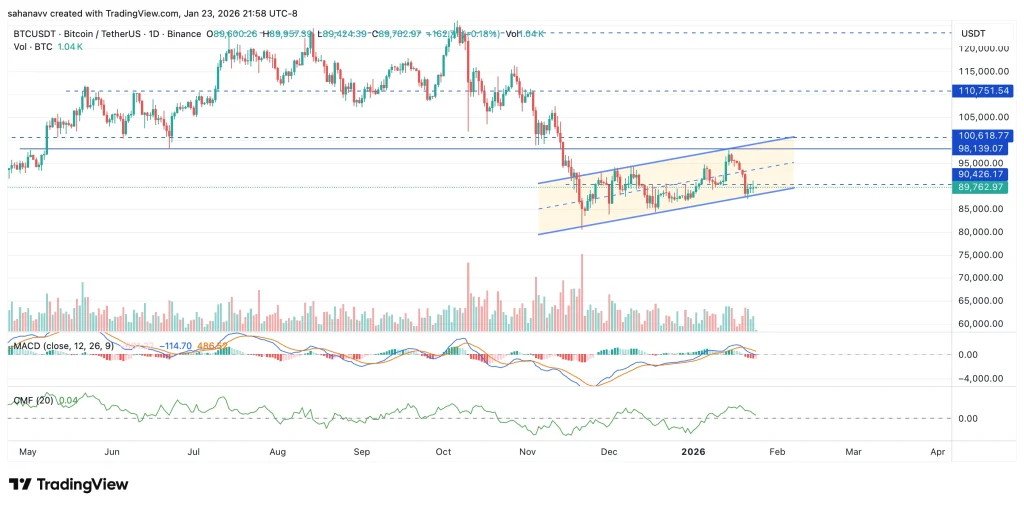
Technically, BTC is ranging within an ascending channel (rising support and rising resistance), which often acts as a corrective structure after a drop. Price is currently around $89,763, near the channel’s lower half, while nearby levels sit at $90,426, $98,139, $100,619, and $110,752. MACD is rolling over toward a bearish crossover, hinting at weakening upside momentum. CMF is slightly positive, suggesting mild inflows, but not strong enough to confirm a breakout yet.
The Bottom Line
Bitcoin’s daily chart suggests the trend is neutral-to-cautious in the short term. Price is still respecting the rising channel, but momentum has cooled, and BTC is slipping back toward the lower half of the structure. If buyers defend the $90K area and BTC reclaims the midline, a push toward $98K–$100.6K becomes more likely. But if BTC loses channel support, downside risk opens quickly, with a deeper correction on the table.