XRP Price Downtrend Extends — Sellers Target Fresh Lows After Support Break


XRP price started a fresh decline below $2.50. The price is now showing bearish signs and is at risk of more losses below $2.30 in the near term.
- XRP price gained bearish momentum and traded below $2.350.
- The price is now trading below $2.420 and the 100-hourly Simple Moving Average.
- There is a bearish trend line forming with resistance at $2.550 on the hourly chart of the XRP/USD pair (data source from Kraken).
- The pair could start a recovery wave if it stays above $2.30.
XRP Price Dips Further
XRP price remained in a bearish zone below $2.550 and extended losses, like Bitcoin and Ethereum . The price dipped below the $2.50 and $2.420 levels.
The decline gained pace after there was a close below $2.40. The price even tested $2.250. A low was formed at $2.260, and the price is now correcting some losses. There was a move above the 23.6% Fib retracement level of the downward move from the $2.552 swing high to the $2.260 low.
The price is now trading below $2.40 and the 100-hourly Simple Moving Average. If there is a fresh upward move, the price might face resistance near the $2.40 level and the 50% Fib retracement level of the downward move from the $2.552 swing high to the $2.260 low.
The first major resistance is near the $2.480 level, above which the price could rise and test $2.550. There is also a bearish trend line forming with resistance at $2.550 on the hourly chart of the XRP/USD pair.
A clear move above the $2.550 resistance might send the price toward the $2.60 resistance. Any more gains might send the price toward the $2.650 resistance. The next major hurdle for the bulls might be near $2.720.
Another Decline?
If XRP fails to clear the $2.50 resistance zone, it could start a fresh decline. Initial support on the downside is near the $2.320 level. The next major support is near the $2.30 level.
If there is a downside break and a close below the $2.30 level, the price might continue to decline toward $2.250. The next major support sits near the $2.220 zone, below which the price could continue lower toward $2.20.
Technical Indicators
Hourly MACD – The MACD for XRP/USD is now losing pace in the bearish zone.
Hourly RSI (Relative Strength Index) – The RSI for XRP/USD is now below the 50 level.
Major Support Levels – $2.320 and $2.250.
Major Resistance Levels – $2.50 and $2.550.
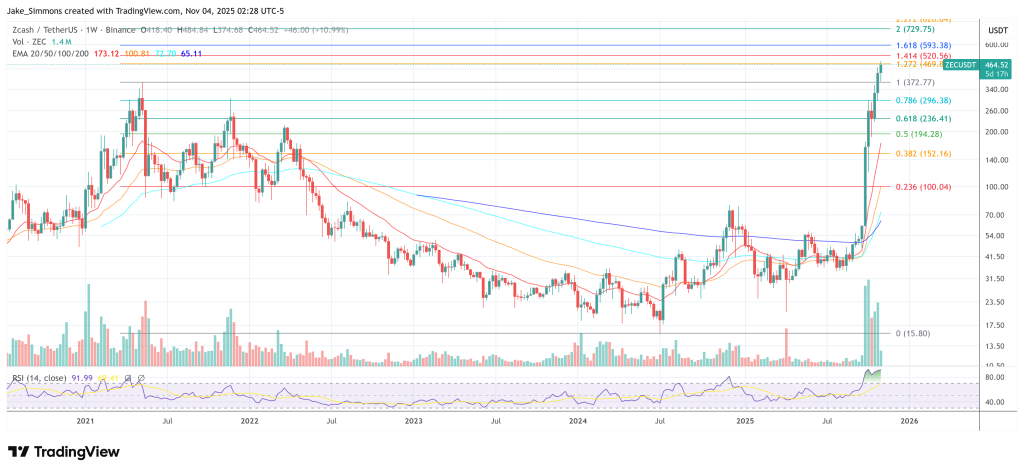
Arthur Hayes Outlines Why Zcash Could Surge To $10,000–$20,000 Fast
Arthur Hayes thinks Zcash can move an order of magnitude faster than most investors expect—and he sp...
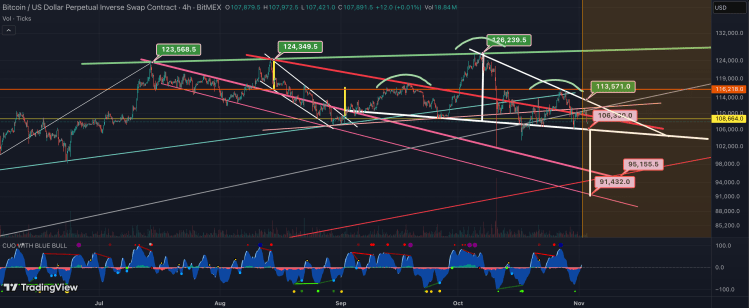
Head And Shoulders Pattern Says Bitcoin Price Is Headed Below $100,000
Amid the bearish pressure that has rocked the market, the Bitcoin price continues to fluctuate aroun...
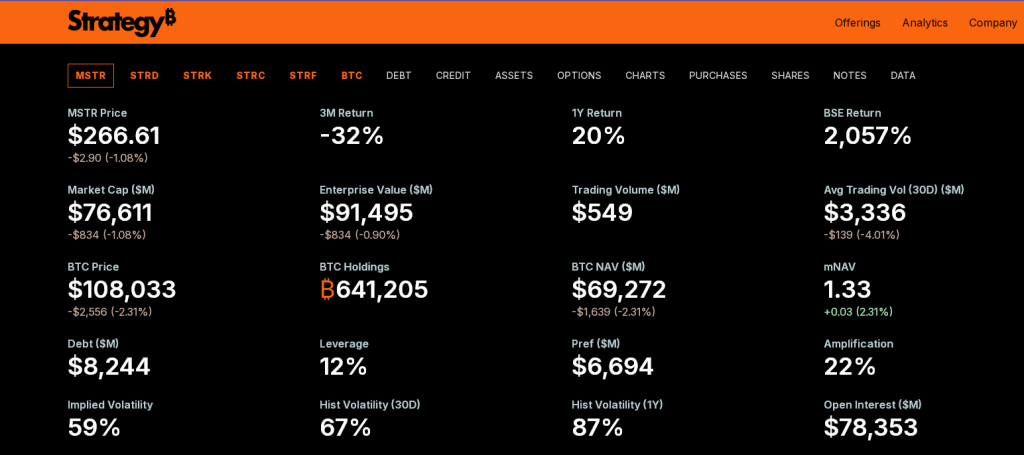
Bitcoin May Be This Week’s Big Story As Saylor Teases Fresh Buy
Michael Saylor sent a short, cryptic message on X on November 2, 2025: “Orange is the color of Novem...