Bitcoin Sell-Off Continues — Downside Momentum Builds Across Crypto Market


Bitcoin price is gaining bearish pace below $108,800. BTC could continue to move down if it stays below the $109,500 resistance.
- Bitcoin started a fresh decline below the $109,000 support.
- The price is trading below $108,000 and the 100 hourly Simple moving average.
- There is a bearish trend line forming with resistance at $109,400 on the hourly chart of the BTC/USD pair (data feed from Kraken).
- The pair might continue to move down if it trades below the $105,000 zone.
Bitcoin Price Dips Further
Bitcoin price failed to stay above the $110,000 support level and started a fresh decline . BTC dipped below $109,000 and $108,800 to enter a bearish zone.
The decline was such that the price traded below the 76.4% Fib retracement level of the upward move from the $106,310 swing low to the $111,000 high. Besides, there is a bearish trend line forming with resistance at $109,400 on the hourly chart of the BTC/USD pair.
Bitcoin is now trading below $108,000 and the 100 hourly Simple moving average . BTC tested the 1.236 Fib extension level of the upward move from the $106,310 swing low to the $111,000 high.
If the bulls attempt a recovery wave, the price could face resistance near the $108,200 level. The first key resistance is near the $108,800 level. The next resistance could be $109,500 and the trend line. A close above the $109,500 resistance might send the price further higher. In the stated case, the price could rise and test the $110,000 resistance. Any more gains might send the price toward the $111,500 level. The next barrier for the bulls could be $112,000 and $112,500.
More Losses In BTC?
If Bitcoin fails to rise above the $108,800 resistance zone, it could continue to move down. Immediate support is near the $106,200 level. The first major support is near the $105,500 level.
The next support is now near the $105,000 zone. Any more losses might send the price toward the $104,200 support in the near term. The main support sits at $103,500, below which BTC might struggle to recover in the short term.
Technical indicators:
Hourly MACD – The MACD is now gaining pace in the bearish zone.
Hourly RSI (Relative Strength Index) – The RSI for BTC/USD is now below the 50 level.
Major Support Levels – $106,200, followed by $105,500.
Major Resistance Levels – $108,800 and $109,500.
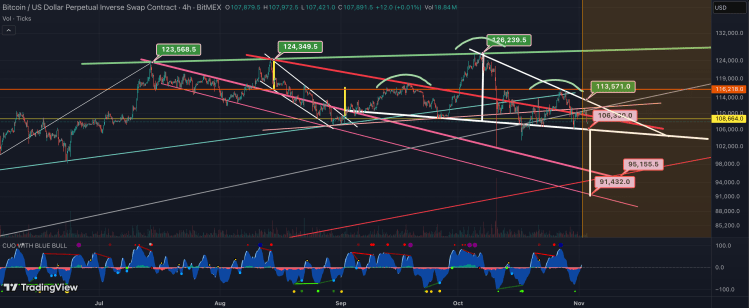
Head And Shoulders Pattern Says Bitcoin Price Is Headed Below $100,000
Amid the bearish pressure that has rocked the market, the Bitcoin price continues to fluctuate aroun...
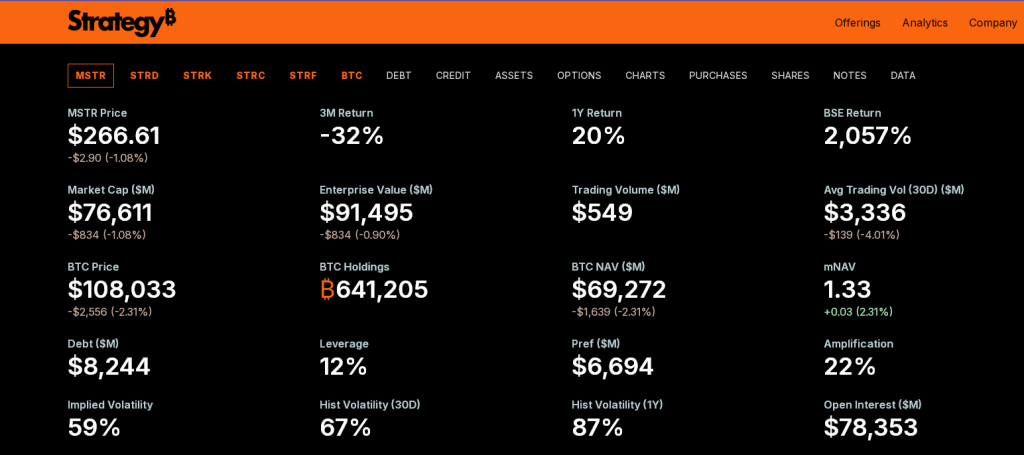
Bitcoin May Be This Week’s Big Story As Saylor Teases Fresh Buy
Michael Saylor sent a short, cryptic message on X on November 2, 2025: “Orange is the color of Novem...
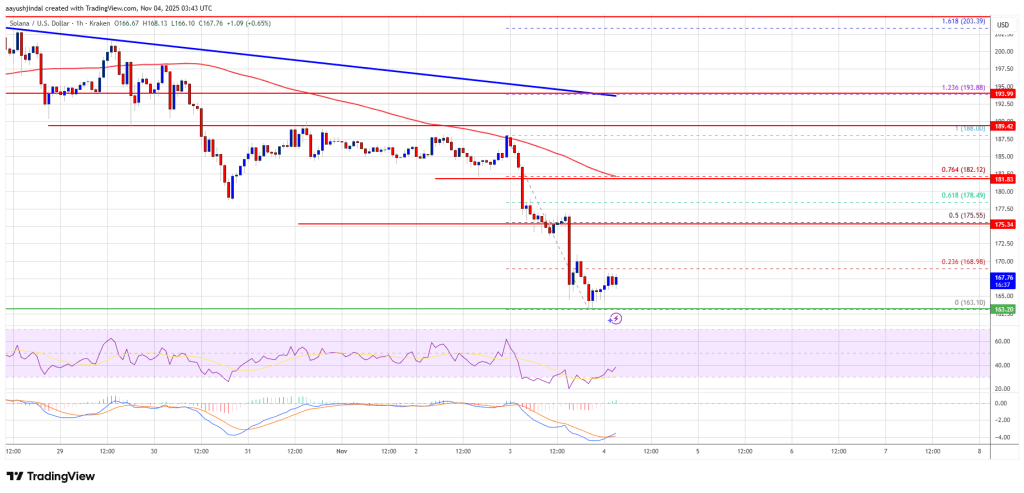
Solana (SOL) Decline Intensifies — Bears Tighten Grip, Recovery Looks Unlikely
Solana started a fresh decline below the $180 zone. SOL price is now consolidating losses below $175...