Bitcoin Price Analysis: Bearish Divergence Hints at a Possible Correction Ahead


The post Bitcoin Price Analysis: Bearish Divergence Hints at a Possible Correction Ahead appeared first on Coinpedia Fintech News
The Bitcoin (BTC) price is showing signs of exhaustion after weeks of steady gains, hovering near $112,900 at the time of writing. Despite briefly testing highs above $115,900, the flagship crypto is struggling to maintain bullish momentum. Technical indicators now suggest a potential slowdown, as traders eye key support levels around $110,000. With market sentiment turning cautious, Bitcoin’s next move could determine whether it consolidates for another breakout or enters a short-term corrective phase.
Bearish Divergence Signals Possible Correction Ahead
The chart shared by analyst Ali highlights a striking similarity between Bitcoin’s current price structure and its 2021 market top. It shows that while Bitcoin’s price has been forming higher highs—currently peaking near $115,900—the Relative Strength Index (RSI) on the weekly timeframe has been printing lower highs, forming a clear bearish divergence. This indicates weakening buying momentum even as prices climb, often a precursor to a potential trend reversal or market correction.
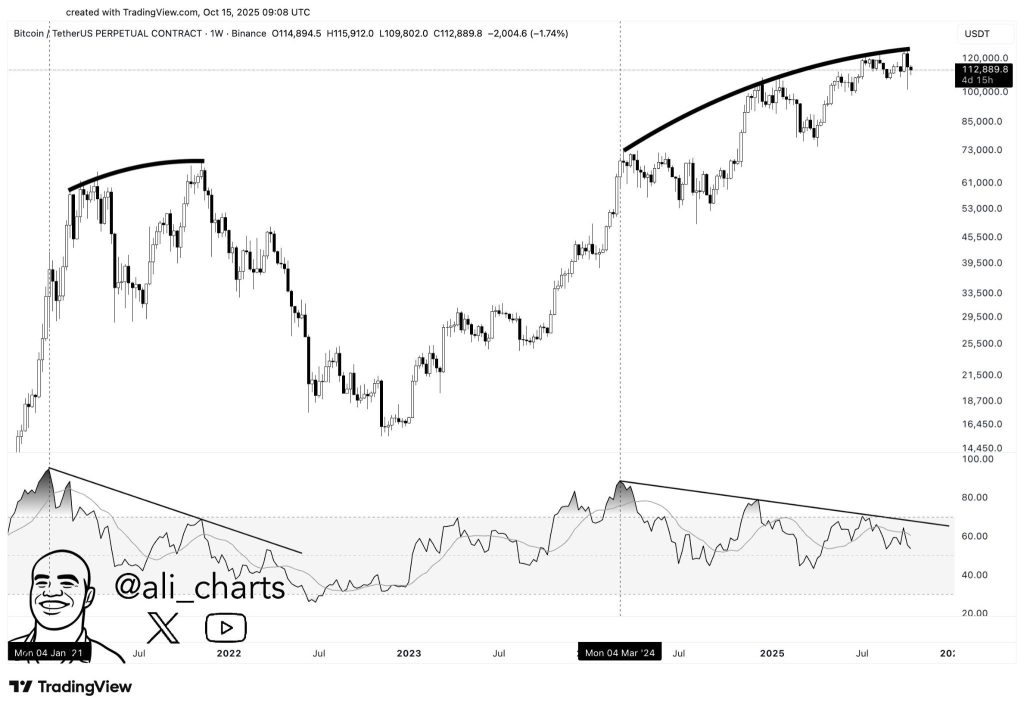
The chart also outlines a curved resistance pattern, suggesting Bitcoin could be forming a “rounded top.” This structure typically appears when upward momentum starts fading and sellers begin to take control gradually. If Bitcoin fails to sustain above $110,000, the bearish divergence could play out, leading to a deeper pullback toward the $95,000–$100,000 range. Conversely, a breakout in RSI above its descending trendline could invalidate the bearish scenario, signaling renewed strength and opening the path toward $125,000 and beyond.
Wrapping it Up
In conclusion, the Bitcoin price appears to be approaching a critical inflection point, with technical indicators flashing early warning signs of a possible trend reversal. The bearish divergence between BTC’s price and RSI suggests fading momentum, similar to patterns seen before previous market corrections. While Bitcoin remains fundamentally strong, a short-term pullback toward the $95,000–$100,000 range cannot be ruled out. Traders should stay cautious around the $110,000 support, as the next move will likely determine whether BTC resumes its rally or enters a consolidation phase.

Top Altcoins To Buy and Hold This Week
The post Top Altcoins To Buy and Hold This Week appeared first on Coinpedia Fintech NewsThe month o...

WazirX on Track to Resume Operations in India
The post WazirX on Track to Resume Operations in India appeared first on Coinpedia Fintech NewsWazi...
Solana Price Weakens—Is This the Start of a 15% Correction or a Buy-the-Dip Opportunity?
The post Solana Price Weakens—Is This the Start of a 15% Correction or a Buy-the-Dip Opportunity? ap...