Bitcoin Price Gains Steam – $112K Level Could Decide the Next Surge


Bitcoin price is attempting a recovery wave above $111,500. BTC is now rising and might gain pace if it clears the $112,000 resistance level.
- Bitcoin started a recovery wave above the $111,000 zone.
- The price is trading above $111,000 and the 100 hourly Simple moving average.
- There is a connecting bearish trend line forming with resistance at $111,600 on the hourly chart of the BTC/USD pair (data feed from Kraken).
- The pair might start another decline if it stays below the $112,500 zone.
Bitcoin Price Eyes Upside Break
Bitcoin price started a fresh recovery wave above the $109,650 zone. BTC was able to climb above the $110,200 and $110,500 resistance levels.
The recent swing low was formed at $109,369 before the price climbed again. There was a move above the 50% Fib retracement level of the recent decline from the $112,537 swing high to the $109,369 low. However, the bears are active below the $112,000 level.
Bitcoin is now trading above $111,000 and the 100 hourly Simple moving average . Immediate resistance on the upside is near the $111,600 level. Besides, there is a connecting bearish trend line forming with resistance at $111,600 on the hourly chart of the BTC/USD pair.
The first key resistance is near the $111,800 level or the 76.4% Fib retracement level of the recent decline from the $112,537 swing high to the $109,369 low. The next resistance could be $112,000. A close above the $112,000 resistance might send the price further higher. In the stated case, the price could rise and test the $112,500 resistance level. Any more gains might send the price toward the $113,200 level. The main target could be $115,000.
Another Drop In BTC?
If Bitcoin fails to rise above the $112,000 resistance zone, it could start a fresh decline. Immediate support is near the $111,000 level. The first major support is near the $110,350 level.
The next support is now near the $109,350 zone. Any more losses might send the price toward the $108,500 support in the near term. The main support sits at $107,500, below which BTC might decline sharply.
Technical indicators:
Hourly MACD – The MACD is now gaining pace in the bullish zone.
Hourly RSI (Relative Strength Index) – The RSI for BTC/USD is now above the 50 level.
Major Support Levels – $110,350, followed by $109,350.
Major Resistance Levels – $112,000 and $112,500.

XRP To Surpass Bitcoin? Pundit Reveals What Will Drive The Takeover
The debate over whether XRP could surpass Bitcoin has gained intensity in this cycle, and many analy...
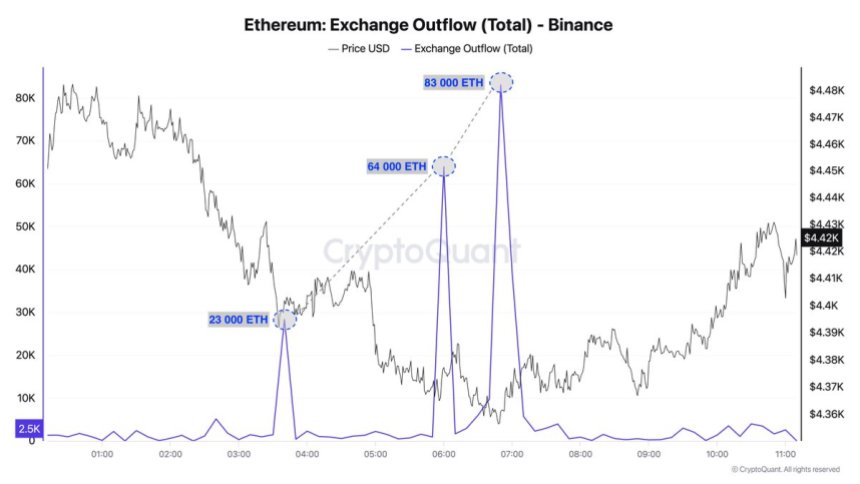
Binance Sees Massive Ethereum Whale Outflows: Demand Remains Strong
Ethereum has entered a consolidation phase after losing the $4,500 level, now trading within a tight...
Analyst Predicts The XRP Price If 10% Of Global Assets Are Tokenized
Crypto analyst Costa has made an ultra-bullish prediction for the XRP price, stating that it could r...