XRP Price Recovery Fails – Is It Doomed for Another Collapse?


XRP price is attempting to recover above the $2.80 zone. The price is now facing hurdles near $2.88 and might start another decline below $2.80.
- XRP price is attempting to recover above the $2.80 resistance.
- The price is now trading above $2.80 and the 100-hourly Simple Moving Average.
- There was a break below a short-term rising channel with support at $2.850 on the hourly chart of the XRP/USD pair (data source from Kraken).
- The pair could continue to rise if it stays above the $2.8120 zone.
XRP Price Faces Resistance
XRP price managed to stay above the $2.720 level and started a recovery wave, like Bitcoin and Ethereum . The price climbed above the $2.75 and $2.80 resistance levels.
There was a move above the 50% Fib retracement level of the downward move from the $3.040 swing high to the $2.70 low. However, the price seems to be struggling to stay above the $2.880 resistance zone. Recently, there was a break below a short-term rising channel with support at $2.850 on the hourly chart of the XRP/USD pair.
The price is now trading above $2.80 and the 100-hourly Simple Moving Average. If the bulls protect the $2.8120 support, the price could attempt another increase. On the upside, the price might face resistance near the $2.880 level.
The first major resistance is near the $2.9160 level or the 61.8% Fib retracement level of the downward move from the $3.040 swing high to the $2.70 low. A clear move above the $2.9160 resistance might send the price toward the $2.960 resistance. Any more gains might send the price toward the $3.00 resistance. The next major hurdle for the bulls might be near $3.050.
Another Drop?
If XRP fails to clear the $2.880 resistance zone, it could continue to move down. Initial support on the downside is near the $2.8120 level. The next major support is near the $2.80 level.
If there is a downside break and a close below the $2.80 level, the price might continue to decline toward $2.740. The next major support sits near the $2.70 zone, below which the price could gain bearish momentum.
Technical Indicators
Hourly MACD – The MACD for XRP/USD is now losing pace in the bullish zone.
Hourly RSI (Relative Strength Index) – The RSI for XRP/USD is now below the 50 level.
Major Support Levels – $2.8120 and $2.80.
Major Resistance Levels – $2.880 and $2.9160.

Germany’s Biggest TV Channel Features Ripple, XRP On Air
Ripple and its native token XRP have been given rare mainstream exposure on German finance channel D...
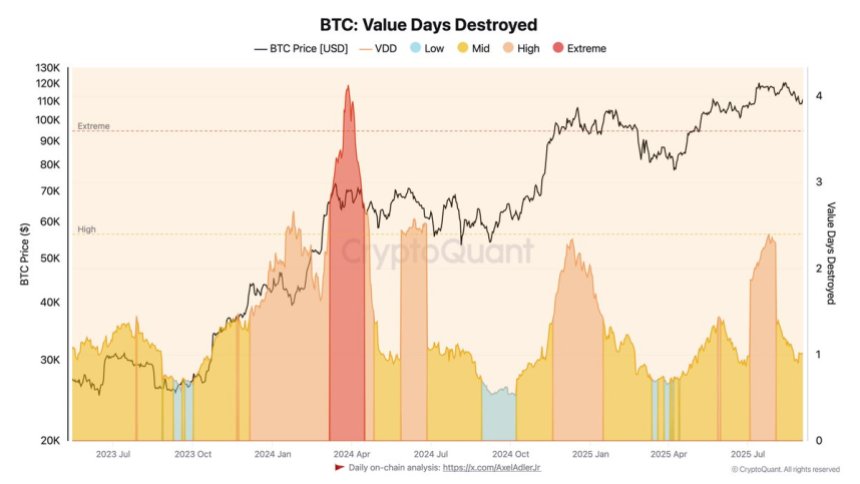
Bitcoin Cycle Structure Questioned As VDD Mirrors Historic Tops
Bitcoin is trading above the $112,000 level, but its momentum is faltering as selling pressure inten...

AI Agents Are Hungry; Web3 Data Is a Mess : Why an AI-Ready Data Layer Is the Need of the Hour
AI agents are simple to describe and complex to serve: observe → decide → act → learn. Each loop dep...