XRP Price Warning: Larger Correction Looms After Recent Weakness


XRP price is struggling to clear the $3.080 resistance zone. The price is now declining and might extend losses if it drops below $2.920.
- XRP price is correcting gains from the $3.080 resistance.
- The price is now trading near $2.9650 and the 100-hourly Simple Moving Average.
- There is a key bearish trend line forming with resistance at $3.020 on the hourly chart of the XRP/USD pair (data source from Kraken).
- The pair could continue to decline if it stays below the $3.050 zone.
XRP Price Faces Hurdles
XRP price started a downside correction from $3.0850, like Bitcoin and Ethereum . The price traded below the $3.0650 and $3.050 levels.
The bears were able to push the price below $2.980 and the 100-hourly Simple Moving Average. Moreover, there was a spike below the 50% Fib retracement level of the upward move from the $2.824 swing low to the $3.080 high.
The price is now trading below $2.9650 and the 100-hourly Simple Moving Average. There is also a key bearish trend line forming with resistance at $3.020 on the hourly chart of the XRP/USD pair.
If the bulls protect the $2.920 support, the price could attempt another increase. On the upside, the price might face resistance near the $3.00 level. The first major resistance is near the $3.020 level. A clear move above the $3.020 resistance might send the price toward the $3.080 resistance. Any more gains might send the price toward the $3.120 resistance. The next major hurdle for the bulls might be near $3.150.
More Losses?
If XRP fails to clear the $3.020 resistance zone, it could continue to move down. Initial support on the downside is near the $2.920 level or the 61.8% Fib retracement level of the upward move from the $2.824 swing low to the $3.080 high. The next major support is near the $2.8850 level.
If there is a downside break and a close below the $2.8850 level, the price might continue to decline toward $2.80. The next major support sits near the $2.780 zone, below which the price could gain bearish momentum.
Technical Indicators
Hourly MACD – The MACD for XRP/USD is now gaining pace in the bearish zone.
Hourly RSI (Relative Strength Index) – The RSI for XRP/USD is now below the 50 level.
Major Support Levels – $2.920 and $2.840.
Major Resistance Levels – $3.020 and $3.080.

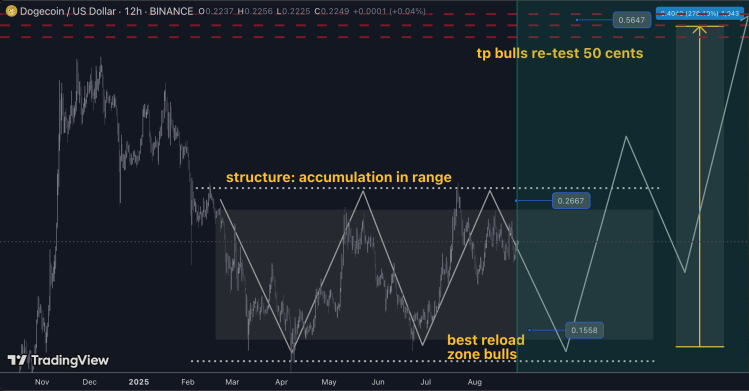
Pundit Reveals Catalysts That Will Drive Dogecoin Price 150% To $0.55
After the market crash, the Dogecoin price suffered a decline to $0.2, which presented as a perfect ...

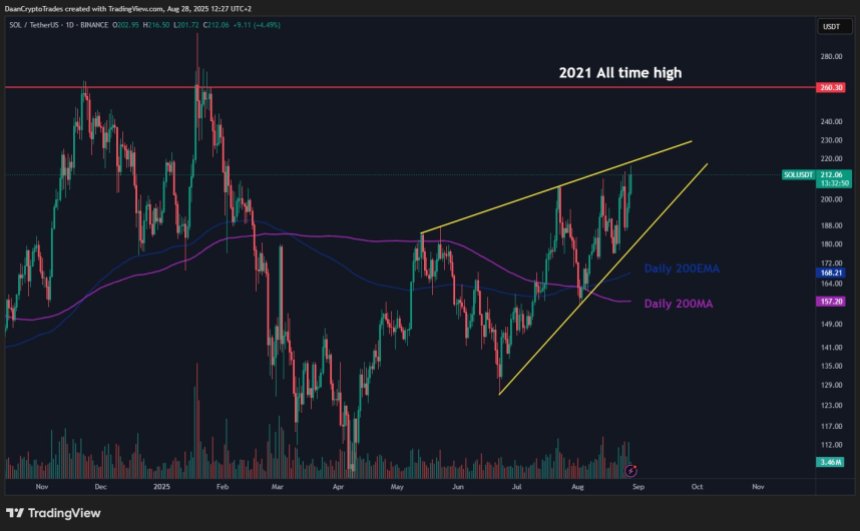
Another Short-Lived Solana Rally? Here’s Why It May Be Different This Time
Solana (SOL) is attempting to reclaim a strong resistance zone for the fourth time, which has led so...

Over 100 Crypto Companies Join Forces To Protect DeFi In Market Structure Bill
115 crypto companies, investors, and organizations have come together to urge the US Senate to incor...

