Bitcoin 10% Off Its Highs—But Hidden On-Chain Data Tells a Different Story


Bitcoin (BTC) remains under pressure after failing to recover momentum following its recent record high above $124,000. At the time of writing, the asset is trading at $112,0474, reflecting a decline of 7.5% in the past two weeks.
The latest movements come as analysts examine on-chain metrics to assess whether the current slowdown represents a pause in the ongoing bull cycle or the beginning of a broader correction.
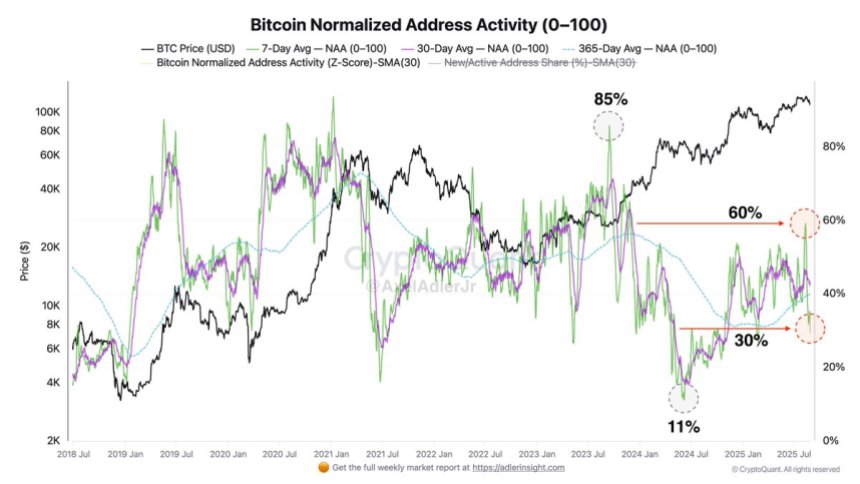
One of the key indicators gaining attention is Bitcoin’s active addresses metric. According to PelinayPA, a contributor on CryptoQuant’s QuickTake platform, the number of active addresses has consistently remained high, suggesting that network usage is stable despite the recent price retracement.
Active Address Growth Signals Resilient User Base
The analyst notes that long-term data shows a strong correlation between address activity and market cycles, with spikes often coinciding with peaks and declines aligning with bear markets.
PelinayPA outlined how active addresses have historically tracked Bitcoin’s broader price behavior . From 2010 through 2016, addresses expanded steadily as Bitcoin’s adoption grew.

The 2017 bull run brought a sharp increase, while the 2018–2019 downturn saw a decline in both addresses and price. The most recent cycle again highlighted the relationship, with addresses surging alongside Bitcoin’s run to new highs in 2020–2021 before dropping in 2022 during the market correction.
Since 2023, however, activity has stabilized, with daily active addresses consistently ranging between 900,000 and 1 million. As of now, approximately 919,000 addresses are active, reflecting sustained network use.
PelinayPA emphasized that while addresses alone are not a perfect price predictor, consistently elevated activity provides long-term support for Bitcoin’s valuation.
If addresses maintain levels above 1 million, it could underpin the case for further gains, with potential targets in the $150,000–$200,000 range. Conversely, a sharp decline in address activity would signal reduced demand and raise the likelihood of a reversal toward the $80,000–$90,000 range.
Bitcoin Exchange Inflows Reach Multi-Year Lows
In addition to user activity, exchange inflows offer another perspective on current market conditions. CryptoOnchain, another CryptoQuant analyst, highlighted that Bitcoin’s 30-day moving average of inflows has dropped to its lowest level since May 2023.
Historically, low exchange inflows suggest reduced selling pressure, as fewer coins are being moved to trading platforms for liquidation. This trend is particularly notable on major exchanges such as Coinbase and Binance.
On Coinbase, a platform often associated with US and institutional investors, inflows have significantly decreased, pointing to diminished selling activity from large holders. A similar pattern is visible on Binance, which continues to host the highest global trading volumes.
According to CryptoOnchain, the combination of lower inflows and rising price levels may indicate an environment where available supply is constrained, creating conditions that could support higher valuations in the mid-term.

Featured image created with DALL-E, Chart from TradingView
Bitcoin Normalized Address Activity Drops To 30%: Selling Pressure Eases
Bitcoin is trading at a critical level after successfully holding above $110,000 as support, but mar...
Bitcoin And The September Curse: Can This Time Be Different?
Bitcoin heads into the final days of August with choppy, two-way trade and a familiar seasonal quest...

Trump Media and Crypto.com Deal Sends Cronos Sky-High: These 3 Altcoins Could Be Next
In a surprising move, Trump Media and Technology Group Inc. and Crypto.com announced a landmark part...