XRP Price Holds Ground, But Can Bulls Push Momentum Higher?


XRP price is holding above $2.920 support zone. The price is now consolidating and might soon attempt a move above the $3.050 resistance.
- XRP price is showing bearish signs below the $3.080 resistance.
- The price is now trading near $2.980 and the 100-hourly Simple Moving Average.
- There was a break below a key contracting triangle with support at $3.020 on the hourly chart of the XRP/USD pair (data source from Kraken).
- The pair could continue to decline if it stays below the $3.10 zone.
XRP Price Starts Consolidation
XRP price started a downside correction from $3.0850, like Bitcoin and Ethereum . The price traded below the $3.050 and $3.000 levels.
The price dipped below the 23.6% Fib retracement level of the upward move from the $2.824 swing low to the $3.080 high. Besides, there was a break below a key contracting triangle with support at $3.020 on the hourly chart of the XRP/USD pair.
However, the price found support near the $2.950 zone. It seems like the bulls are protecting the 50% Fib retracement level of the upward move from the $2.824 swing low to the $3.080 high. The price is now trading near $2.980 and the 100-hourly Simple Moving Average. If the bulls remain in action, the price could attempt another increase.
On the upside, the price might face resistance near the $3.020 level. The first major resistance is near the $3.080 level. A clear move above the $3.080 resistance might send the price toward the $3.120 resistance. Any more gains might send the price toward the $3.150 resistance. The next major hurdle for the bulls might be near $3.20.
Another Decline?
If XRP fails to clear the $3.080 resistance zone, it could start a fresh decline. Initial support on the downside is near the $2.950 level. The next major support is near the $2.9220 level.
If there is a downside break and a close below the $2.9220 level, the price might continue to decline toward $2.840. The next major support sits near the $2.780 zone, below which the price could gain bearish momentum.
Technical Indicators
Hourly MACD – The MACD for XRP/USD is now losing pace in the bearish zone.
Hourly RSI (Relative Strength Index) – The RSI for XRP/USD is now below the 50 level.
Major Support Levels – $2.920 and $2.840.
Major Resistance Levels – $3.080 and $3.120.
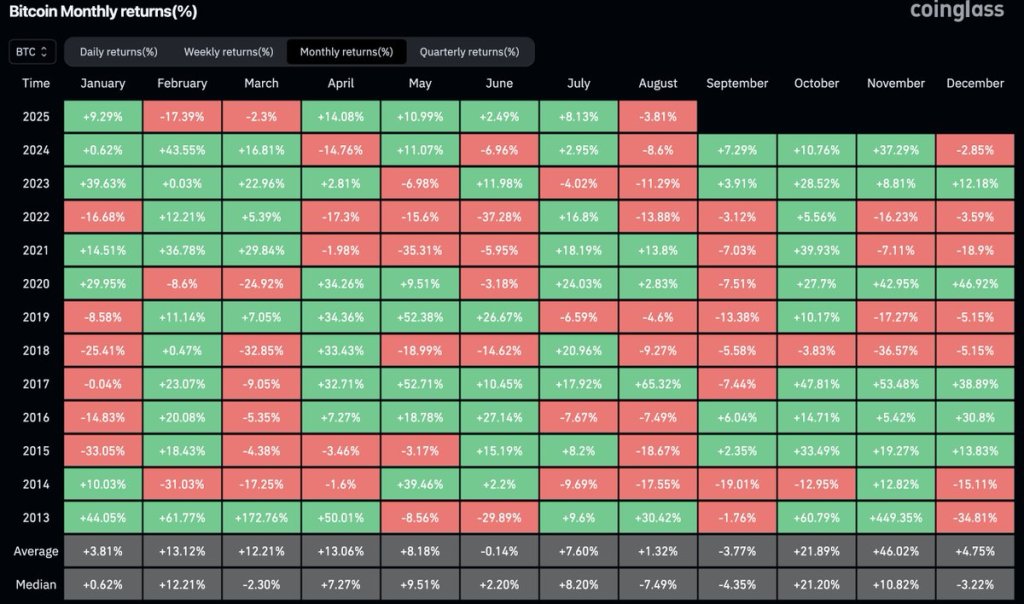
Bitcoin And The September Curse: Can This Time Be Different?
Bitcoin heads into the final days of August with choppy, two-way trade and a familiar seasonal quest...
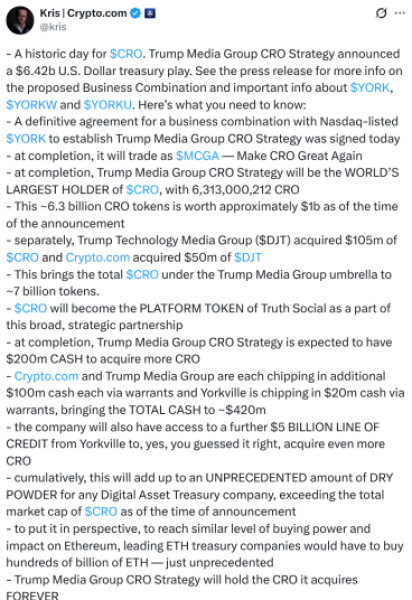
Trump Media and Crypto.com Deal Sends Cronos Sky-High: These 3 Altcoins Could Be Next
In a surprising move, Trump Media and Technology Group Inc. and Crypto.com announced a landmark part...
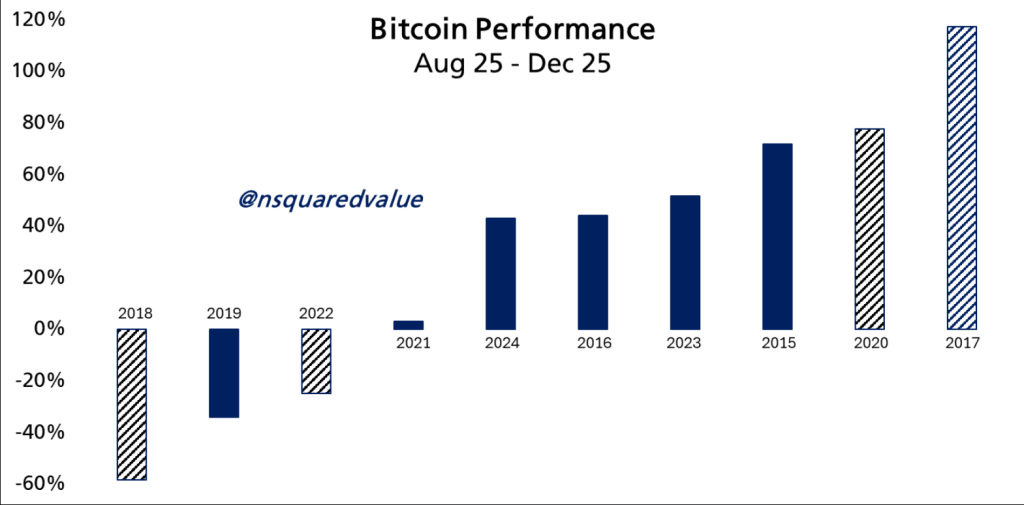
$160K Bitcoin By Christmas? Analysts Say It’s Still Possible
Bitcoin slid to levels not seen since early July this week, but some analysts say the drop may be on...