Bitcoin Price Stays in Red, Can Bulls Regain Lost Ground Soon?


Bitcoin price is attempting to recover from $112,000. BTC is back above $113,200 but faces many hurdles on the way up to $118,000.
- Bitcoin started a recovery wave above the $112,500 zone.
- The price is trading below $115,000 and the 100 hourly Simple moving average.
- There is a key bearish trend line forming with resistance at $113,500 on the hourly chart of the BTC/USD pair (data feed from Kraken).
- The pair might start another increase if it clears the $115,000 resistance zone.
Bitcoin Price Faces Resistance
Bitcoin price started a fresh decline after a close below the $115,000 level. BTC gained bearish momentum and traded below the $113,200 support zone.
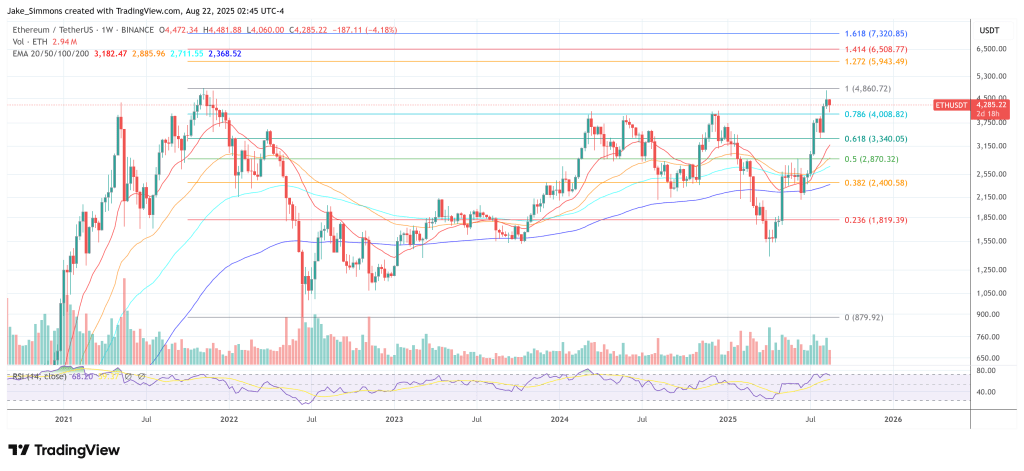
There was a move below the $112,500 support zone and the 100 hourly Simple moving average. The pair tested the $112,000 zone. A low was formed at $112,100 and the price is now attempting to recover toward the 23.6% Fib retracement level of the recent decline from the $124,420 swing high to the $112,100 low.
Bitcoin is now trading below $114,000 and the 100 hourly Simple moving average . Immediate resistance on the upside is near the $113,500 level. There is also a key bearish trend line forming with resistance at $113,500 on the hourly chart of the BTC/USD pair.
The first key resistance is near the $114,500 level. The next resistance could be $115,000. A close above the $115,000 resistance might send the price further higher. In the stated case, the price could rise and test the $116,500 resistance level. Any more gains might send the price toward the $118,200 level. It is close to the 50% Fib retracement level of the recent decline from the $124,420 swing high to the $112,100 low. The main target could be $120,000.
More Downside In BTC?
If Bitcoin fails to rise above the $114,500 resistance zone, it could start a fresh decline. Immediate support is near the $112,500 level. The first major support is near the $112,000 level.
The next support is now near the $110,500 zone. Any more losses might send the price toward the $108,250 support in the near term. The main support sits at $105,500, below which BTC might take a major hit.
Technical indicators:
Hourly MACD – The MACD is now losing pace in the bearish zone.
Hourly RSI (Relative Strength Index) – The RSI for BTC/USD is now above the 50 level.
Major Support Levels – $112,500, followed by $112,000.
Major Resistance Levels – $113,500 and $115,000.
Ethereum Vs. Solana: Arthur Hayes Picks His Winner For This Cycle
Arthur Hayes has a clear answer to the market’s favorite bar fight. In an August 21 interview with R...
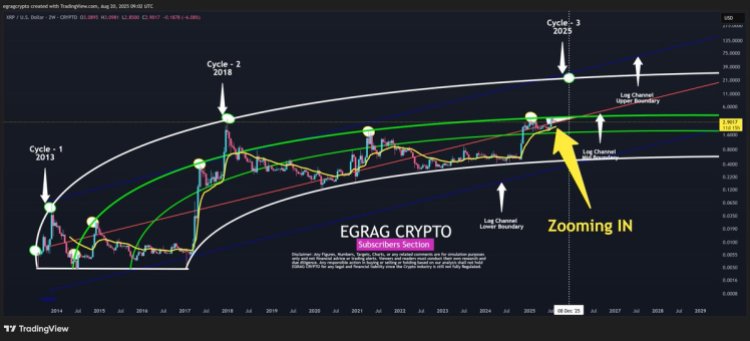
Analyst Puts XRP Cycle Top Above $20, But Says Price Must Hold Last Line Of Defense
Crypto analyst EGRAG CRYPTO has long been one of the most vocal bulls of XRP, calling for higher pri...
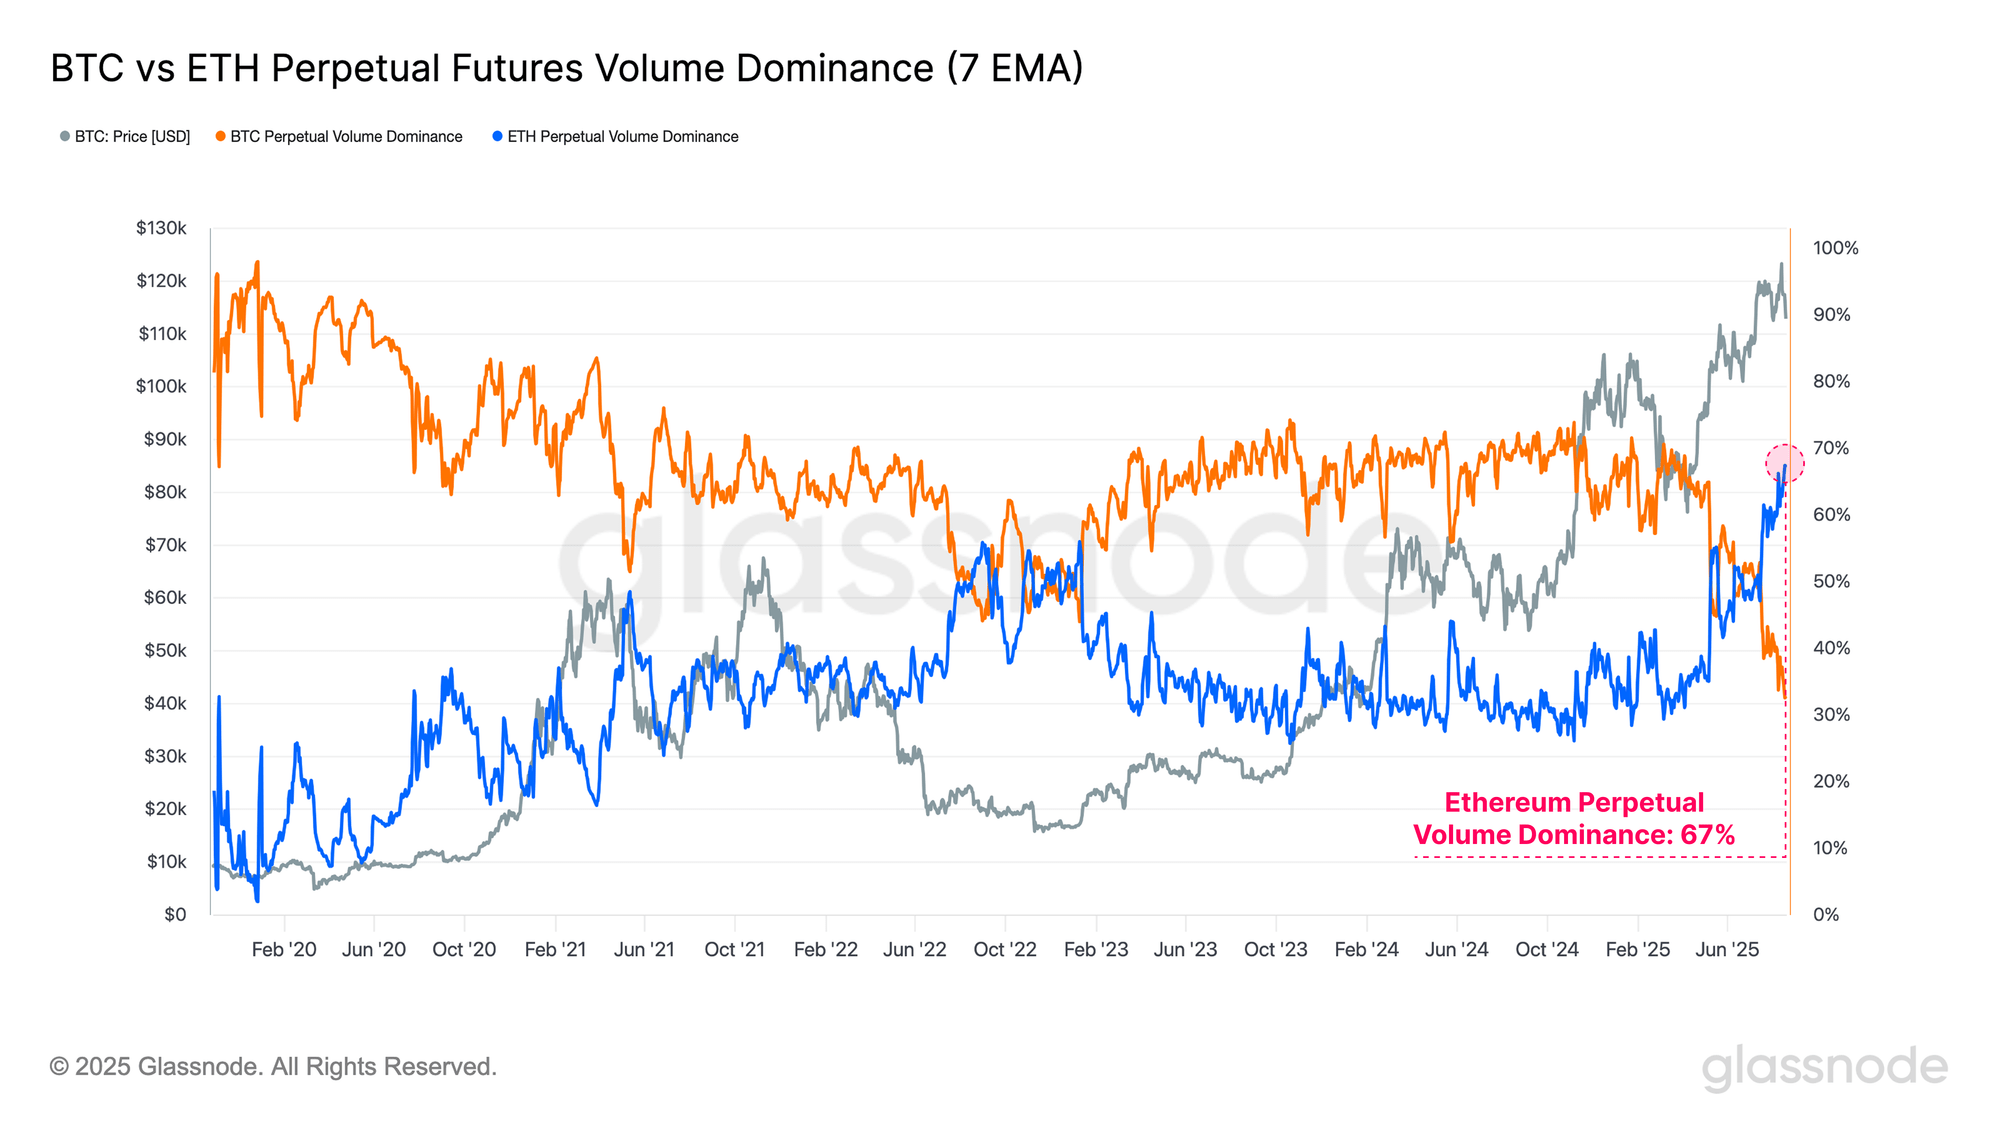
Altseason Things: Ethereum Perps Volume Sets New Record Against Bitcoin
Data shows the Ethereum perpetual futures volume dominance has set a new all-time high relative to B...