XRP Price Holding Weak Below $3.10, Bears Maintain Their Edge


XRP price is gaining bearish pace below the $3.10 resistance zone. The price is struggling near $3.050 and remains at risk of more losses.
- XRP price is declining below the $3.150 and $3.10 levels.
- The price is now trading below $3.10 and the 100-hourly Simple Moving Average.
- There is a bearish trend line forming with resistance at $3.070 on the hourly chart of the XRP/USD pair (data source from Kraken).
- The pair could regain bullish momentum if it clears the $3.120 zone.
XRP Price Dips Further
XRP price remained in a bearish zone after a close below the $3.20 level, like Bitcoin and Ethereum . The price extended losses and traded below the $3.10 support zone.
The price even declined below $3.00. Finally, it tested the $2.950 support zone. A low was formed at $2.941 and the price recently attempted a recovery wave above the 50% Fib retracement level of the downward move from the $3.148 swing high to the $2.941 low.
However, the bears were active near $3.10 and the 76.4% Fib retracement level of the downward move from the $3.148 swing high to the $2.941 low. There is also a bearish trend line forming with resistance at $3.070 on the hourly chart of the XRP/USD pair.
The price is now trading below $3.050 and the 100-hourly Simple Moving Average. On the upside, the price might face resistance near the $3.0450 level. The first major resistance is near the $3.070 level.
A clear move above the $3.070 resistance might send the price toward the $3.120 resistance. Any more gains might send the price toward the $3.150 resistance or the 50% Fib retracement level of the downward move from the $3.350 swing high to the $2.97 low. The next major hurdle for the bulls might be near $3.20.
More Losses?
If XRP fails to clear the $3.070 resistance zone, it could start a fresh decline. Initial support on the downside is near the $2.9420 level. The next major support is near the $2.920 level.
If there is a downside break and a close below the $2.920 level, the price might continue to decline toward the $2.850 support. The next major support sits near the $2.80 zone, below which there could be a larger decline.
Technical Indicators
Hourly MACD – The MACD for XRP/USD is now gaining pace in the bearish zone.
Hourly RSI (Relative Strength Index) – The RSI for XRP/USD is now below the 50 level.
Major Support Levels – $2.940 and $2.880.
Major Resistance Levels – $3.070 and $3.10.
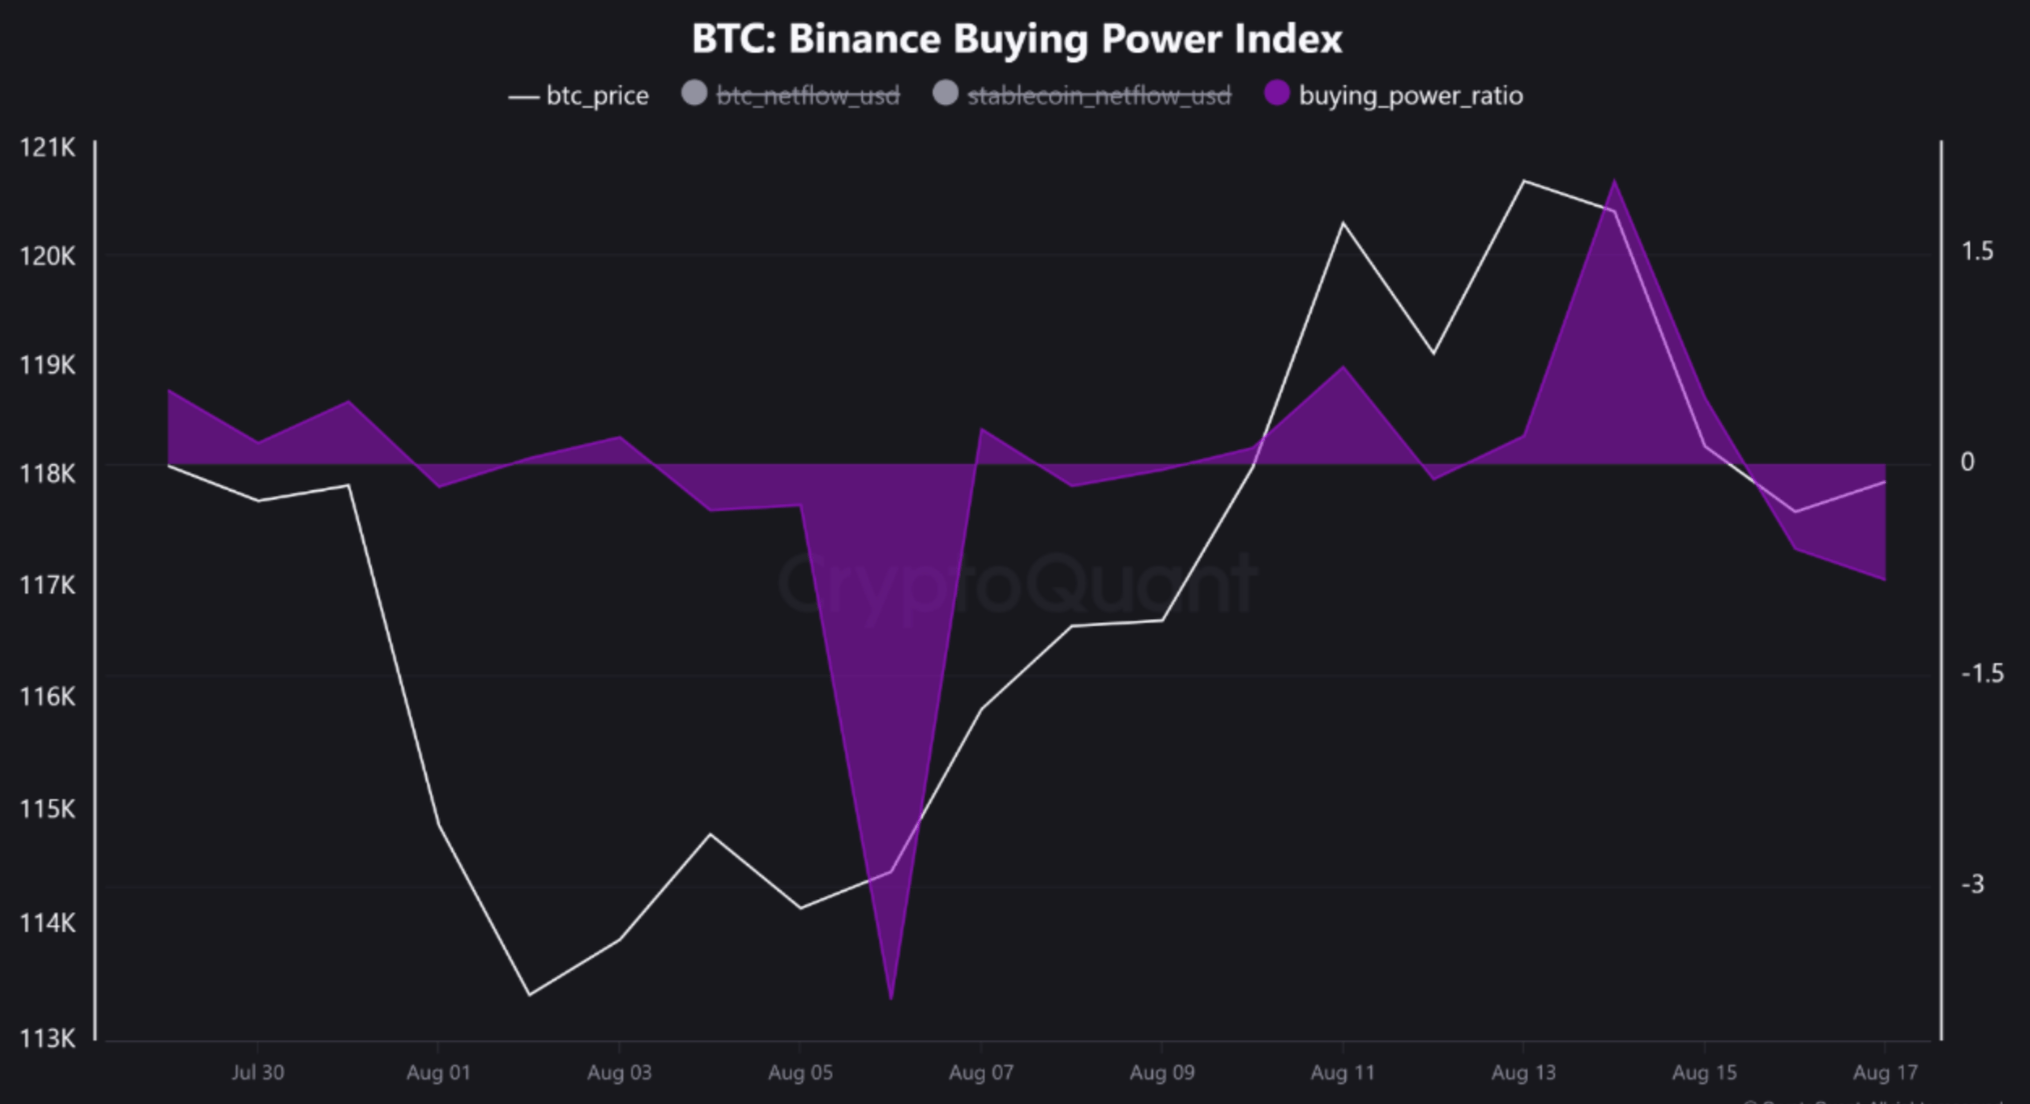
Bitcoin Falls Below $115,000 As Binance Buying Power Ratio Collapses
Earlier today, Bitcoin (BTC) slipped below $115,000 for the first time since August 6, raising conce...

Bitcoin, XRP, ETH’s Pullback: Key Factors Behind The Recent Drop
The cryptocurrency market is experiencing significant price declines, particularly among the three l...
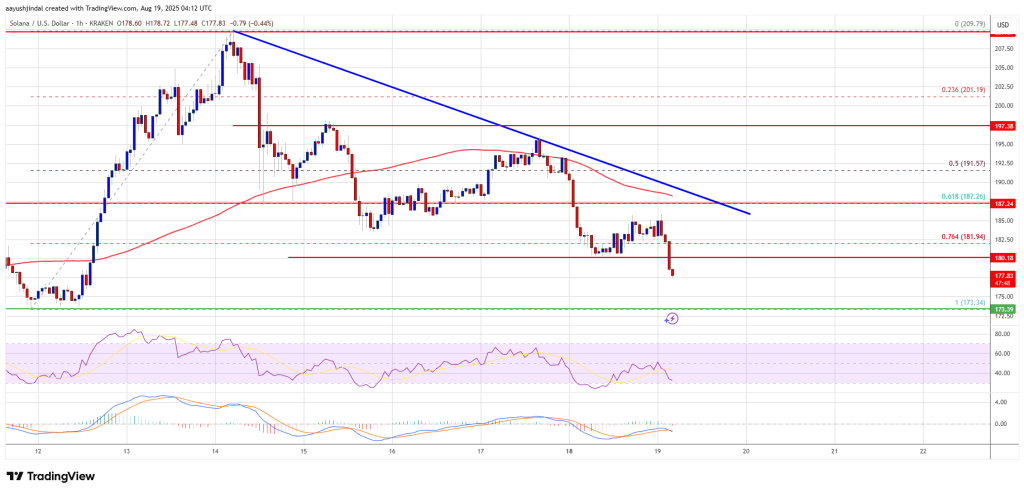
Solana (SOL) Falls Below Support, Will Bears Extend the Decline?
Solana started a fresh decline from the $210 zone. SOL price is now showing bearish signs and might ...