The Grand Bitcoin Roadmap: Crypto Expert Says $160,000 Still In The Works


Bitcoin may be setting up for another major push toward six-figure prices after reclaiming a key bullish pattern and ending a period of repeated downside deviations. According to well-known crypto analyst Rekt Capital, the recent move puts BTC back in position to aim for the $160,000 target, provided it can hold a crucial support level and break through evolving resistance.
While short-term pullbacks are still possible, the broader technical picture remains intact. Historical price behavior suggests Bitcoin is still in a strong upward trend, but time and price pressures could soon force a decision point for the market.
Bitcoin Bull Flag Breakout Revives Long-Term Bullish Outlook
Rekt Capital’s latest analysis highlights that Bitcoin not only reclaimed its Bull Flag pattern but has positioned itself above it. This is an essential shift because a few weeks ago, BTC failed to confirm its breakout when it couldn’t hold the Bull Flag top. That earlier miss left the pattern unresolved and kept the market uncertain about the next big move.
By holding the $119,000 level as new support, BTC can confirm the breakout and solidify the foundation for a rally . The analyst cautions that the price could still dip back into the pattern temporarily, but as long as $119,000 holds, the bullish structure remains in play.
Ending the recent downside deviation adds to the optimism. Several sharp deviations from bullish structures have marked this cycle, but reclaiming and holding above the Bull Flag shows renewed strength from buyers. For long-term bulls, this could be the technical reset needed to keep the $160,000 target alive .

Key Resistance Levels That Stand Between BTC And $160,000
Despite a recent -9% dip, Bitcoin remains in what Rekt Capital calls “Price Discovery Uptrend 2.” This phase, which follows historical price tendencies , has stayed intact because the dip never broke the uptrend’s structure or confirmed a breakdown. However, the move into Week 6 of this uptrend is notable; historically, Weeks 5 and 6 have often been the “danger zone” for local tops.

While history points to a potential pause here, the unique nature of this cycle may allow for an extension. Still, the decisive factor is now price, not just time. The analyst points to resistance that first appeared around $124,000 in July but has since evolved into a dynamic barrier closer to $126,000.
Breaking this level in the next one to two weeks could trigger a sharp acceleration in the trend , putting the $160,000 roadmap back in focus. On the other hand, failure to clear $126,000 would create both time and price confluence for a pullback, which Rekt Capital calls “Price Discovery Correction 2.”
Such a correction would not end the long-term bullish case but would delay the next leg up. Until then, all eyes are on these key levels: $119,000 for support and $126,000 for breakout. How Bitcoin handles them could decide whether the grand roadmap to $160,000 stays on track in the weeks ahead.

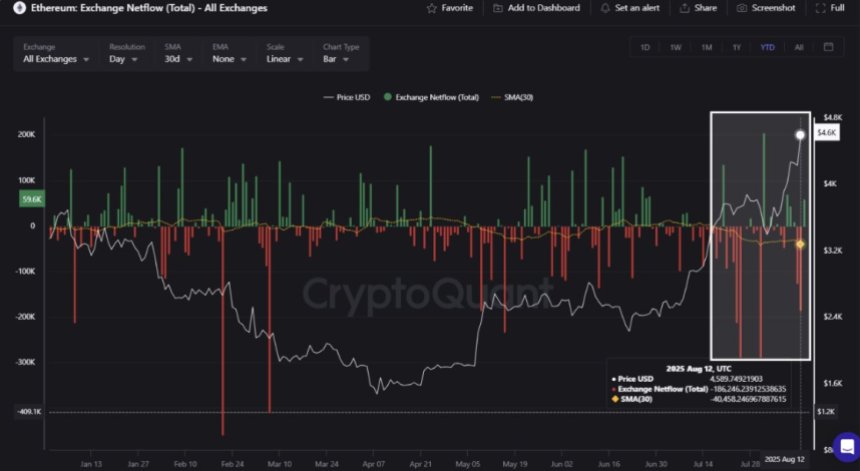
Ethereum 30-Day Netflow Average Deepens Negative: Buyers Dominate Market
Ethereum has surged to multi-year highs around $4,700, marking its strongest level since November 20...
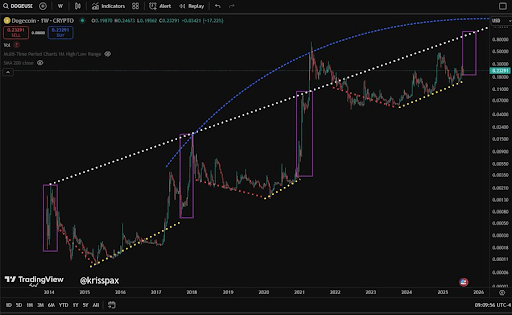
4-Year Cycle Says Dogecoin Price Will Reach $1, Here’s Why
Crypto analyst KrissPax has made a case for why the Dogecoin price could still reach the psychologic...
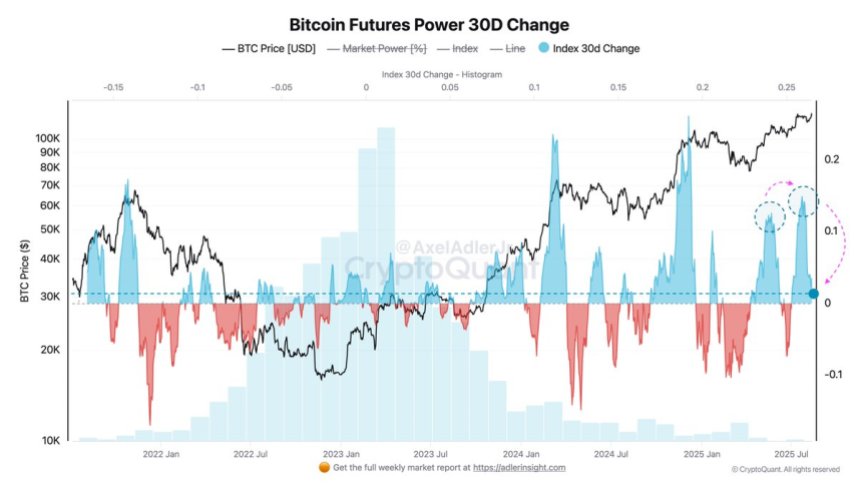
Bitcoin Futures Power Index Hits Neutral Zone After Months Of Bullish Readings – Details
Bitcoin is once again challenging the $120,000 resistance level after a stretch of massive volatilit...