Solana Faces Mid-Channel Standoff As Hourly Weakness Challenges Bullish Structure


Solana remains bullish on the daily chart, cruising within a strong ascending channel and pushing toward the mid-range with fresh upside momentum. However, short-term weakness on the hourly chart shows price slipping below key moving averages, signaling potential pressure.
Daily Chart Holds Bullish Structure
GodstarPL, in a detailed update posted on X, emphasized that Solana is currently cruising inside a strong ascending channel on the daily chart. This steady bullish structure reflects consistent buying interest and price strength over time. At present, SOL is pushing toward the mid-range of this channel, indicating fresh upside momentum and a possible continuation of its upward trajectory.
If the bulls manage to maintain this pressure, the next logical target would be the upper boundary of the channel, which lies near the $220 mark. Reaching this level, which is serving as a crucial resistance zone , would signify a significant milestone, reinforcing the resilience of the current bullish trend and potentially attracting more buying activity.
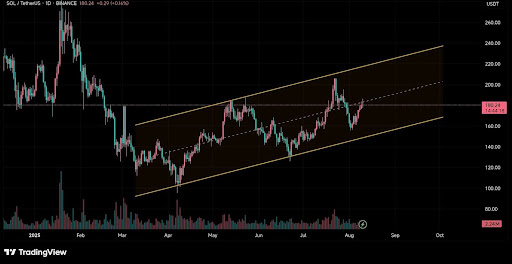
On the other hand, a slip below the channel’s mid-line could trigger a pullback toward the $160 demand zone, a key level that has historically provided strong support. This area is critical for buyers to defend in order to prevent a deeper decline and maintain the overall bullish structure . Monitoring this level will be essential for gauging whether the upward momentum can sustain or if a more significant correction is underway.
Solana Short-Term Trend Shows Signs Of Bearish Behavior
Despite the bullish structure reflected on the daily chart, Gemxbt, in a separate update , pointed out that Solana exhibited a bearish setup on the 1-hour timeframe at the time of the post. Short-term market sentiment has shifted, with price action trading below the 5, 10, and 20-period moving averages — a clear indication of near-term selling pressure.
Adding to this bearish tone, the MACD indicator has crossed below its signal line, indicating the potential for renewed downside momentum. This technical signal often reflects an acceleration of selling interest, particularly when it aligns with other bearish patterns on lower timeframes.
Meanwhile, the Relative Strength Index (RSI) is trending toward oversold territory, which suggests that buying pressure is weakening and sellers remain firmly in control. However, an oversold reading can also hint at a potential short-term bounce if buyers step in to defend key price levels.
In terms of critical levels to watch, support is currently situated around $175, where buyers may attempt to halt a decline. On the upside , immediate resistance is seen near $180. A break above this level is likely to trigger continued upside pressure.

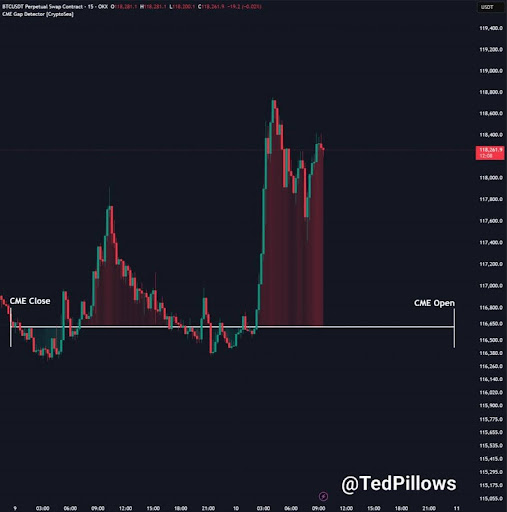
Bitcoin Price Could Hit A Small Roadblock To ATH As CME Gap Threatens Crash
The Bitcoin price has regained momentum, rising toward the $120,000 level after experiencing a short...

Ethereum Surpasses MasterCard In Asset Rankings, Bullish Targets Set
Ethereum’s recent surge has pushed it past another milestone, with the world’s second-largest crypto...
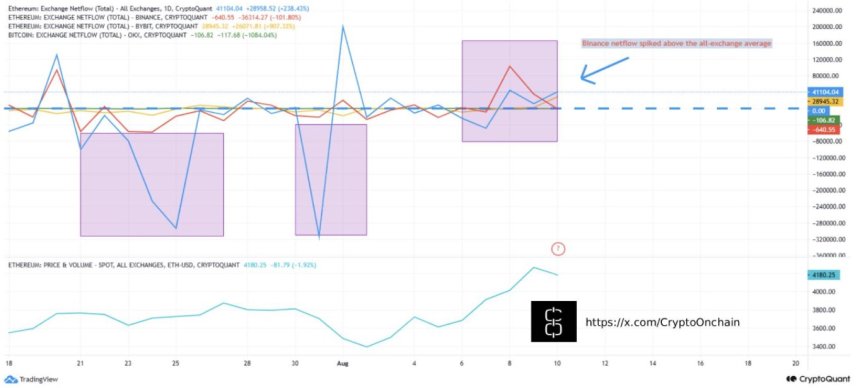
Ethereum Bullish Fundamentals Clash With Short-Term Leverage Risks
Ethereum reached multi-year highs, breaking decisively above the $4,300 level after several days of ...