XRP Breakout Targets $15—Analyst Says ‘This Is Just The Start’


XRP may be entering its most explosive phase in years, according to crypto analyst CryptoInsightUK, who on July 31 released a sweeping technical breakdown that suggests the token’s breakout from a six-year consolidation range could soon send prices to $15—and potentially beyond. “This is just the start,” he said, arguing that the recent monthly close confirms structural strength that has been building quietly over the last two market cycles.
XRP Flashes Bullish Signal—Next Stop: $15?
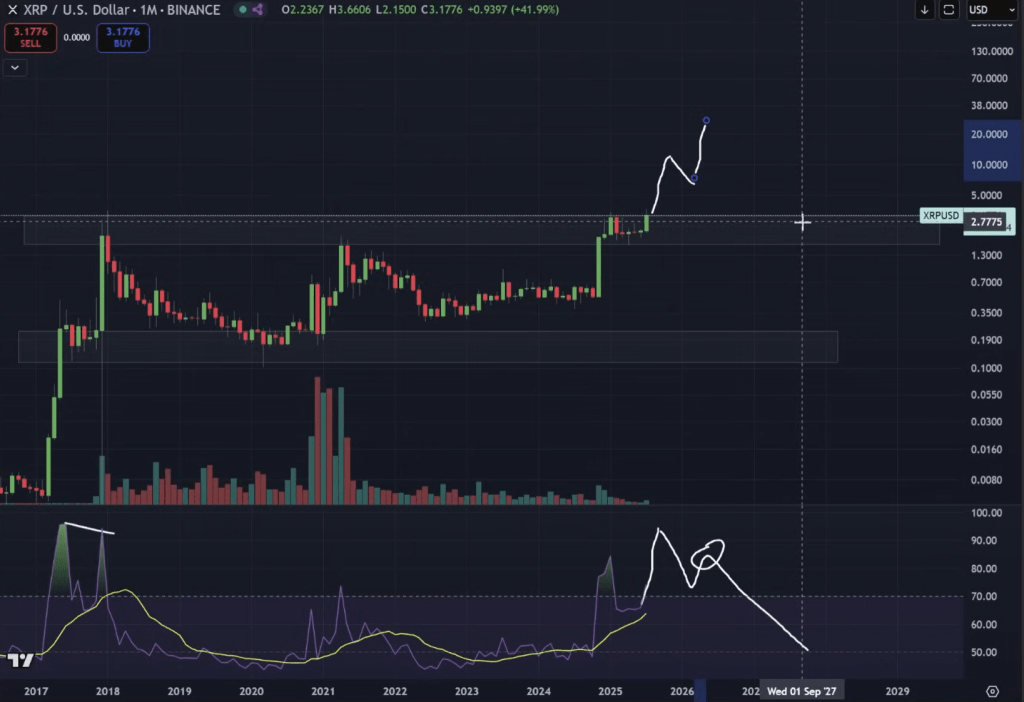
In a video analysis posted to YouTube, the analyst highlighted XRP’s rare technical alignment on the monthly chart, pointing to its sustained break above the 2018 all-time high and an upcoming potential for new highs. His base case targets a move to between $8.70 and $15 in the short-to-medium term, based on historical measured moves and momentum structure. “If we just did a measured move like the last move, it could take us as far out as $15,” he said. “I don’t think that’s unreasonable.”
Supporting the bullish case is a technical signal many market watchers have overlooked: a return of XRP’s monthly Relative Strength Index (RSI) to the overbought zone, historically a precursor to parabolic rallies. In the 2017 cycle, a similar RSI pattern preceded a move of over 700%, and even a “conservative” repeat could lift XRP to well above $10, he explained. “If we make a higher high on the monthly RSI here, to me that doesn’t indicate the move is over,” he said, emphasizing that momentum indicators remain firmly in bullish territory.
He also drew attention to XRP’s relative strength versus Bitcoin , calling its position on the XRP/BTC chart “such a crucial place.” After bouncing from key support levels, XRP/BTC is closing the month significantly higher than nearly all months in recent years. “We’re going to be closing above everything apart from the last couple of months,” he observed. “It’s strong. It’s showing strength.”
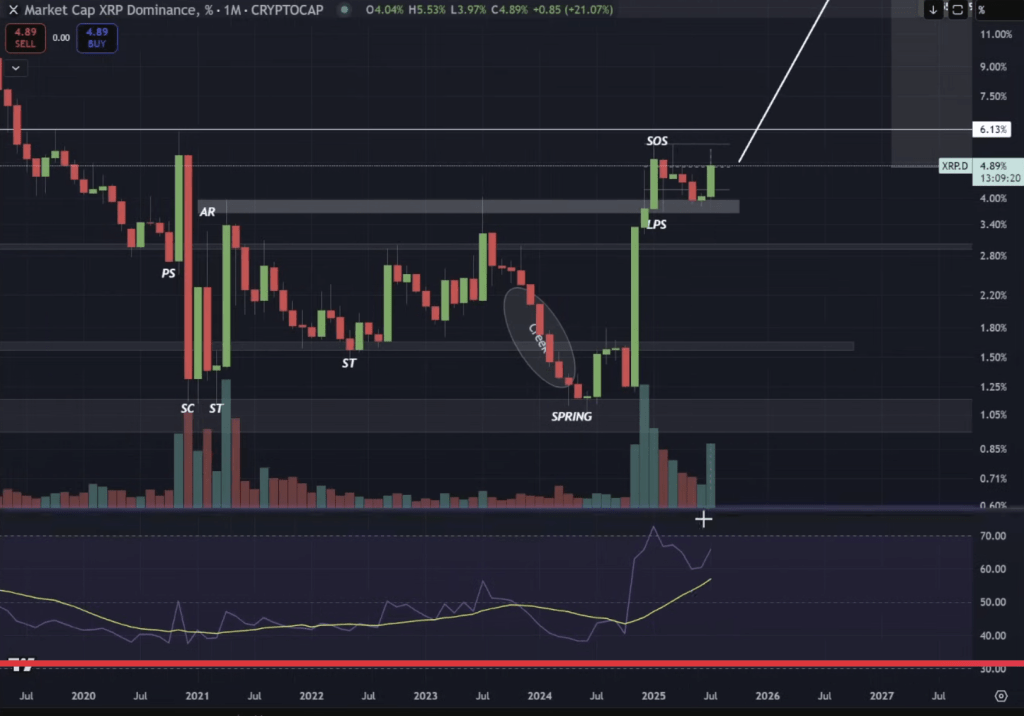
Looking at XRP dominance—a measure of XRP’s market cap share relative to the rest of crypto—CryptoInsightUK noted the token is holding the midpoint of a range formed on top of what he calls the “sign of strength” phase. “We’ve created this range on top of Wyckoff accumulation … Things are looking good there too,” he said.
He further analyzed XRP futures premiums, noting that the negative premium since July 24 resembles the setup before XRP’s last major rally from $0.50 to $2.60. “We actually went red for a bit and that was when we found our lows,” he said. “Then as we broke out of this zone, we went back to being green… and that coincided with the start of the rally.”
The chart structure, momentum indicators, and liquidity maps all point to a scenario where XRP could move sharply higher with relatively minor catalysts. The analyst emphasized that this does not necessarily mean a straight line up, but rather an aggressive trend formation after years of accumulation. “If you actually take a zoomed out perspective on the XRP chart, $15 doesn’t look ridiculous,” he said. “Yes, this is logarithmic, but it really doesn’t.”
He also warned against dismissing high-end projections like $27 or even $50 out of hand, referencing past patterns in both price and RSI. “I’m not suggesting we do that in a month,” he said, “but I don’t think we should rule it out either.”
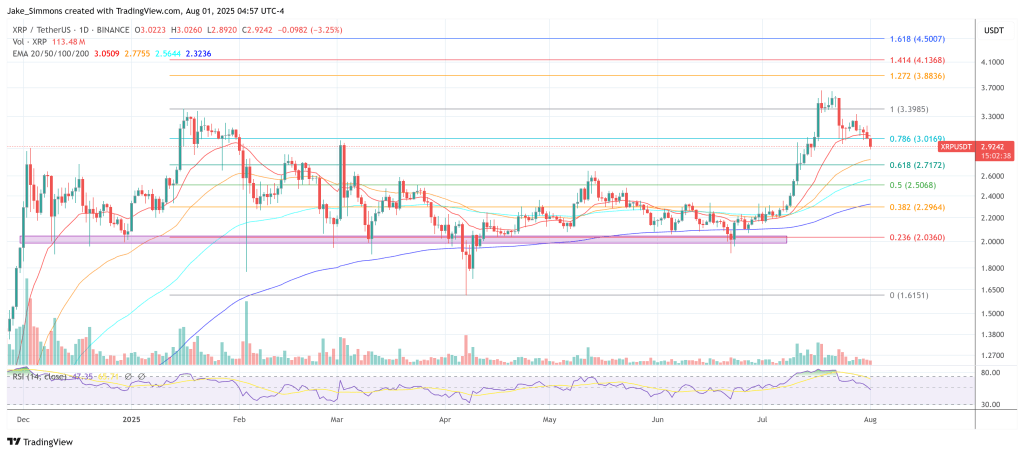
At press time, XRP traded at $2.92.
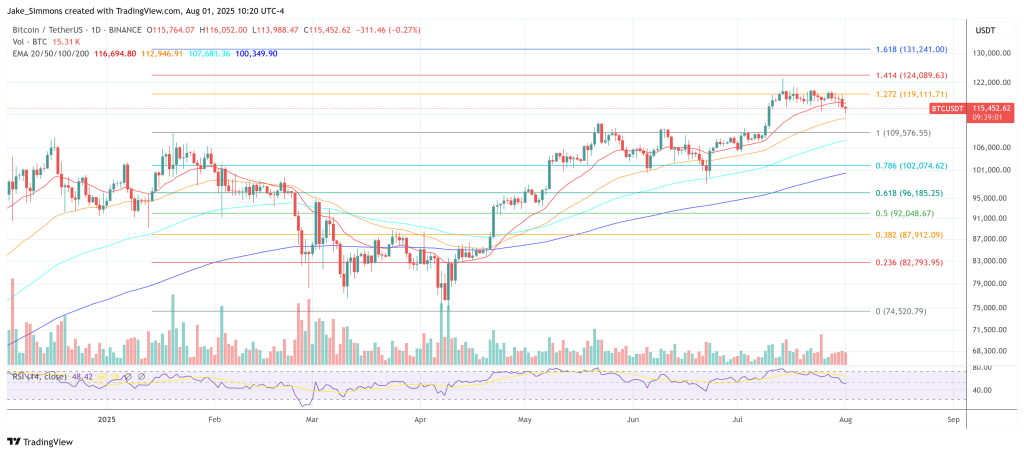
Bitcoin Fakeout? Research Firm Says Momentum Just Flipped Bearish
Bitcoin’s latest push towards $120,000 fizzled into a stall-out that now resembles a “failed breakou...
Ethereum Drops 6% After Hitting $3,800, But Analysts See New ATH Ahead
Ethereum (ETH) dropped over 6% in the past 24 hours, sliding to around $3,630 after briefly touching...

XRP Is Set To Move Trillions — Banking CEO Drops Bombshell On Ripple’s Role In Tokenizing Finance
The Central banks, institutions, and payment corridors are experimenting with something deeper than ...