Bitcoin Price Sets Up for Another Move—Can the Bulls Seal the Deal?


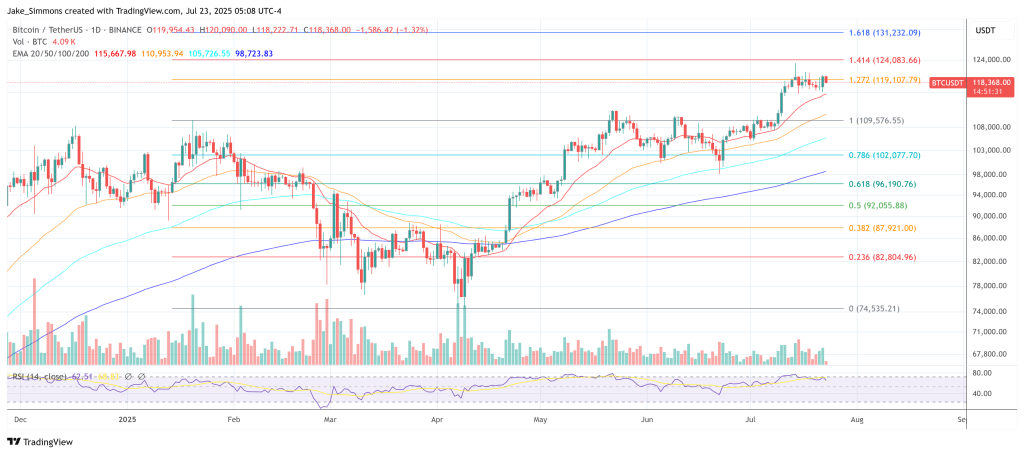
Bitcoin price is eyeing a fresh increase above the $118,000 resistance. BTC must clear the $120,000 resistance zone to continue higher in the near term.
- Bitcoin started a fresh increase after it cleared the $118,000 zone.
- The price is trading above $118,500 and the 100 hourly Simple moving average.
- There was a break above a bearish trend line with resistance at $118,000 on the hourly chart of the BTC/USD pair (data feed from Kraken).
- The pair might start another increase if it clears the $120,000 resistance zone.
Bitcoin Price Aims Higher
Bitcoin price started a correction phase below the $118,500 support zone. BTC dipped below the $118,000 level and tested the $116,200 zone.
A low was formed at $116,260 and the price started another increase. There was a decent move above the $118,000 and $118,500 levels. Besides, there was a break above a bearish trend line with resistance at $118,000 on the hourly chart of the BTC/USD pair.
However, the pair struggled to surpass the $120,000 resistance zone . A high was formed near $120,237 and the price is now consolidating gains near the 23.6% Fib retracement level of the upward move from the $116,260 swing low to the $120,237 high.
Bitcoin is now trading above $118,500 and the 100 hourly Simple moving average. Immediate resistance on the upside is near the $119,800 level. The first key resistance is near the $120,200 level.
The next resistance could be $121,000. A close above the $121,000 resistance might send the price further higher. In the stated case, the price could rise and test the $122,500 resistance level. Any more gains might send the price toward the $122,500 level. The main target could be $123,200.
Another Drop In BTC?
If Bitcoin fails to rise above the $120,200 resistance zone, it could start another decline. Immediate support is near the $119,200 level. The first major support is near the $118,500 level.
The next support is now near the $118,200 zone. Any more losses might send the price toward the $116,500 support in the near term. The main support sits at $115,000, below which BTC might continue to move down.
Technical indicators:
Hourly MACD – The MACD is now losing pace in the bullish zone.
Hourly RSI (Relative Strength Index) – The RSI for BTC/USD is now above the 50 level.
Major Support Levels – $119,200, followed by $118,500.
Major Resistance Levels – $120,200 and $121,000.
Bitcoin $250,000, Ether $10,000 By Year-End? Arthur Hayes Thinks So
Arthur Hayes has never been shy about big numbers, but his latest essay, Time Signature, frames thos...
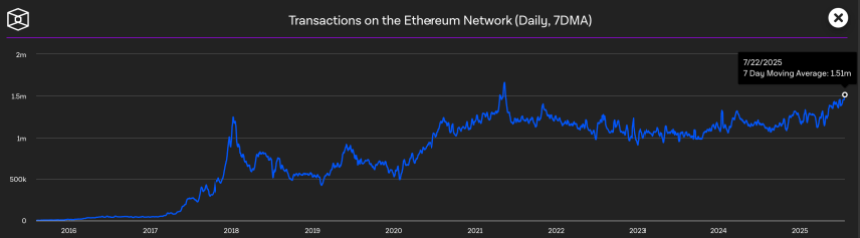
Ethereum Adoption Accelerates As Daily Transactions Set 2025 Record
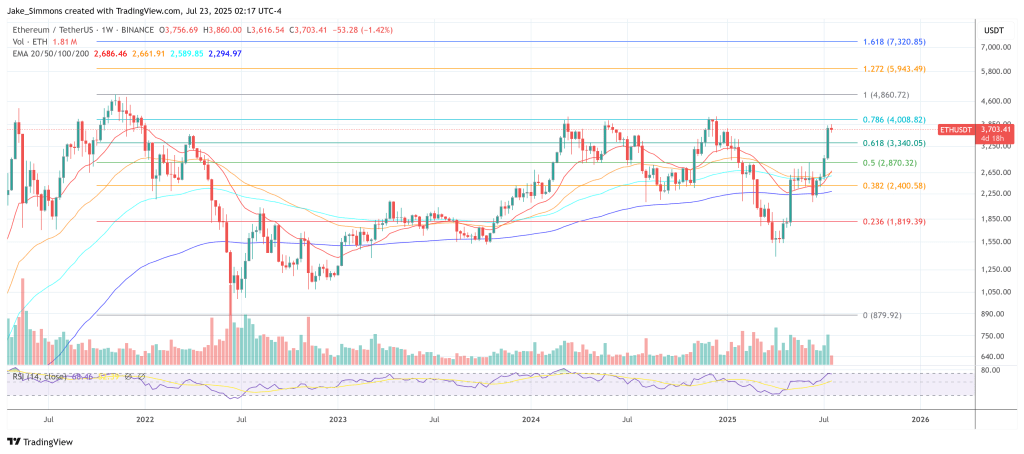
Ethereum is currently consolidating between $3,600 and $3,850 after an explosive rally that saw the ...
Ethereum Demand Shock Will Rock Markets, Bitwise CIO Warns
A sudden surge of institutional and corporate interest in Ethereum (ETH) is setting the stage for wh...