Ethereum ETF Inflows Hit 8-Week Streak—Institutions Still Buying


Data shows the US Ethereum spot ETFs have seen net inflows for eight consecutive weeks now, a sign of continued institutional demand.
Ethereum Spot ETF Netflow Remains Positive
In a new post on X, the on-chain analytics firm Glassnode has shared an update on how the weekly netflow for the US spot exchange-traded funds (ETFs) of Ethereum has been looking. Spot ETFs refer to investment vehicles that allow investors to gain exposure to an asset without having to directly own it. These ETFs trade on the traditional platforms, so they allow for an easier investment method for those who find cryptocurrency exchanges and wallets overwhelming to navigate.
Below is the chart shared by the analytics firm that shows how the American Ethereum spot ETFs have been doing lately:

From the graph, it’s visible that the netflow related to the Ethereum spot ETFs has recently been on a green streak. This means that inflows into wallets attached to the ETFs are continuously happening. Last week saw a net inflow of 61,000 ETH, worth $157.3 million at the current exchange rate. With these inflows, the spot ETFs of the cryptocurrency have seen positive values for eight straight weeks.
Since institutional investors generally take this investment route into Ethereum, the continuous inflows could be a sign of sustained demand from them. Despite this interest, the ETH price has remained locked in a phase of sideways movement.
Ethereum isn’t the only asset that’s observing demand on the ETFs. As the on-chain analytics firm Santiment has pointed out in an X post , Bitcoin has also been enjoying net inflows.

As displayed in the above chart, the Bitcoin ETFs have seen a positive netflow on 16 out of the last 17 trading days. The one exception was on July 1st, when outflows occurred.
In some other news, Ethereum has observed new on-chain capital inflows during the past week, as Glassnode has revealed in another X post .

In the graph, the data for the Realized Cap of coins aged less than 1 week is shown for Ethereum and Solana. The “ Realized Cap ” measures the amount of capital that the investors have put into a given network. The version of the metric of focus here specifically calculates the capital that has come in over the past week.
From the chart, it’s visible that the metric has seen an increase for both ETH and SOL during the past week, indicating fresh capital has flowed in. The latter has outperformed the former, however, with the metric standing at $6.2 billion and $8.3 billion, respectively.
ETH Price
At the time of writing, Ethereum is floating around $2,580, up over 5% in the last week.

XRP Makes Trump’s Unspoken Crypto Top 5—What You Need To Know
Trump Media & Technology Group (TMTG) quietly lodged an S-1 with the US Securities and Exchange Comm...

Tether Secret Swiss Vault: The $8 Billion Gold Reserve Behind The Stablecoin
Tether Holdings, the issuer of the market’s largest stablecoin, USDT, has revealed that it maintains...
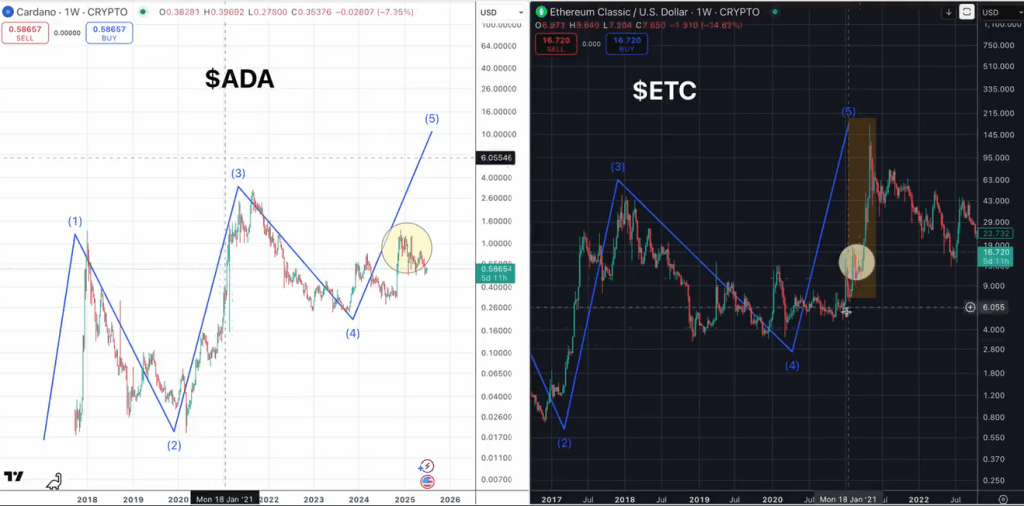
Analyst Predicts 2,000% Cardano Rally: ‘Fractal Is Too Clean To Ignore’
Crypto-market commentator “Quantum Ascend” devoted a 8 June video to a single idea: the price struct...