Ethereum Wave Count Predicts Price Crash To $1,800 — But $6,000 Is Still In Play


Ethereum is still struggling below $3,000 despite the Bitcoin price sitting close to all-time highs. At the current levels, Ethereum continues to look incredibly bearish , with sell-offs dominating the market at this level. While piling shorts are pointing to a possible relief rally, there is also the possibility that the price will crash back down from here. Crypto analyst Weslad maps out the ETH price trajectory using the ABCDE wave structure, showing a possible crash below $2,000.
The Bullish Ethereum Scenario
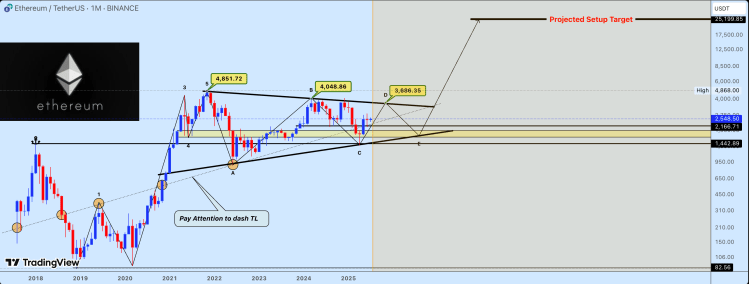
Weslad points to the 2021 Ethereum peak when the price reached $4,851 as the point when a large-scale symmetrical pennant had formed for the digital asset. Interestingly, this has continued for multiple years already, and continues to play out even in 2025, four years later. So far, the analyst believes that the altcoin has been in a long-term accumulation phase in a defined corrective range.
Another important development is the formation of an ABCDE wave pattern. This pattern often predicts peaks and troughs, and depending on where the asset is in the pattern, it could point to a recovery or a crash. Presently, the crypto analyst puts the Ethereum price as being somewhere in a D wave, which is still bullish for the price .
“Currently, price action is developing near point D, approaching the upper boundary of the pennant, a crucial area that could define the next directional move,” the analyst said. If this D wave plays out as expected, then the Ethereum price is expected to actually surge from here. The top of this pattern would put it above $3,500 before the move is completed.
On the upper end of this is the formation of an Inverse Head and Shoulders Pattern. This pattern has seen the $2,855 acting as key resistance, beating the Ethereum price down multiple times this year. However, if a sustained break is achieved above this level , in conjunction with a breakout from Wave D, then it is possible that the price does rally to new all-time highs above $6,000.
The Bearish Scenario
While the formation of the ABCDE wave count points to some bullishness for the Ethereum price , there is still the possibility that the price could go in the opposite direction. For example, after the D wave is completed, comes the next wave in the sequence, which is the E wave, and this is a bearish wave.
As the crypto analyst explains, a temporary rejection at the neckline or pennant resistance would trigger an E wave retracement. In this case, the Ethereum price could see an over 30% crash, putting it back toward the $1,400-$1,800 level, where there is the most support.
“Recent price behavior shows compressed volatility and increased buying interest on dips, reinforcing the possibility of an imminent directional breakout,” Weslad warned. “A decisive move outside this macro structure may mark the beginning of a new phase of long-term price expansion.”

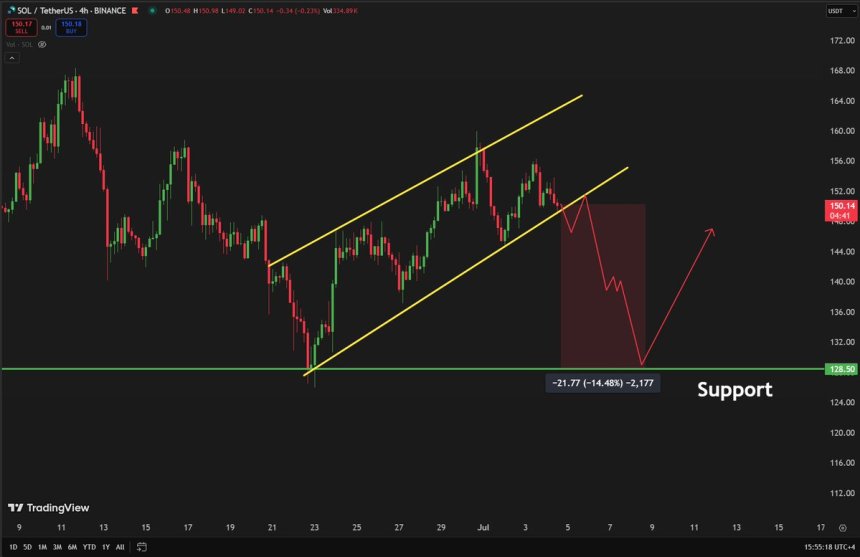
Solana Tests Rising Channel Support – Breakdown Could Send Price To $128.50 Level
Solana is facing a critical test this week, consolidating in a tight range between $145 and $160 sin...
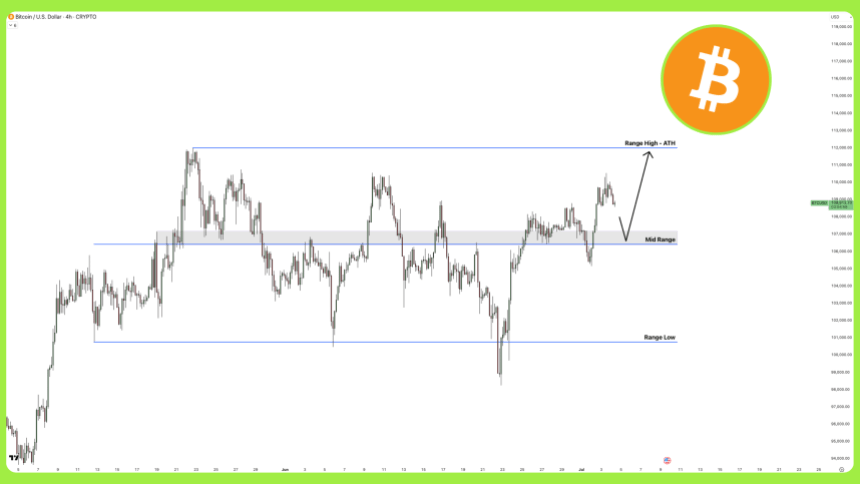
Bitcoin Near Historic Weekly Close Despite Drop – Analyst Warns Of Volatile Weekend
As the market sees a Friday retrace, Bitcoin (BTC) is attempting to reclaim a crucial area as suppor...
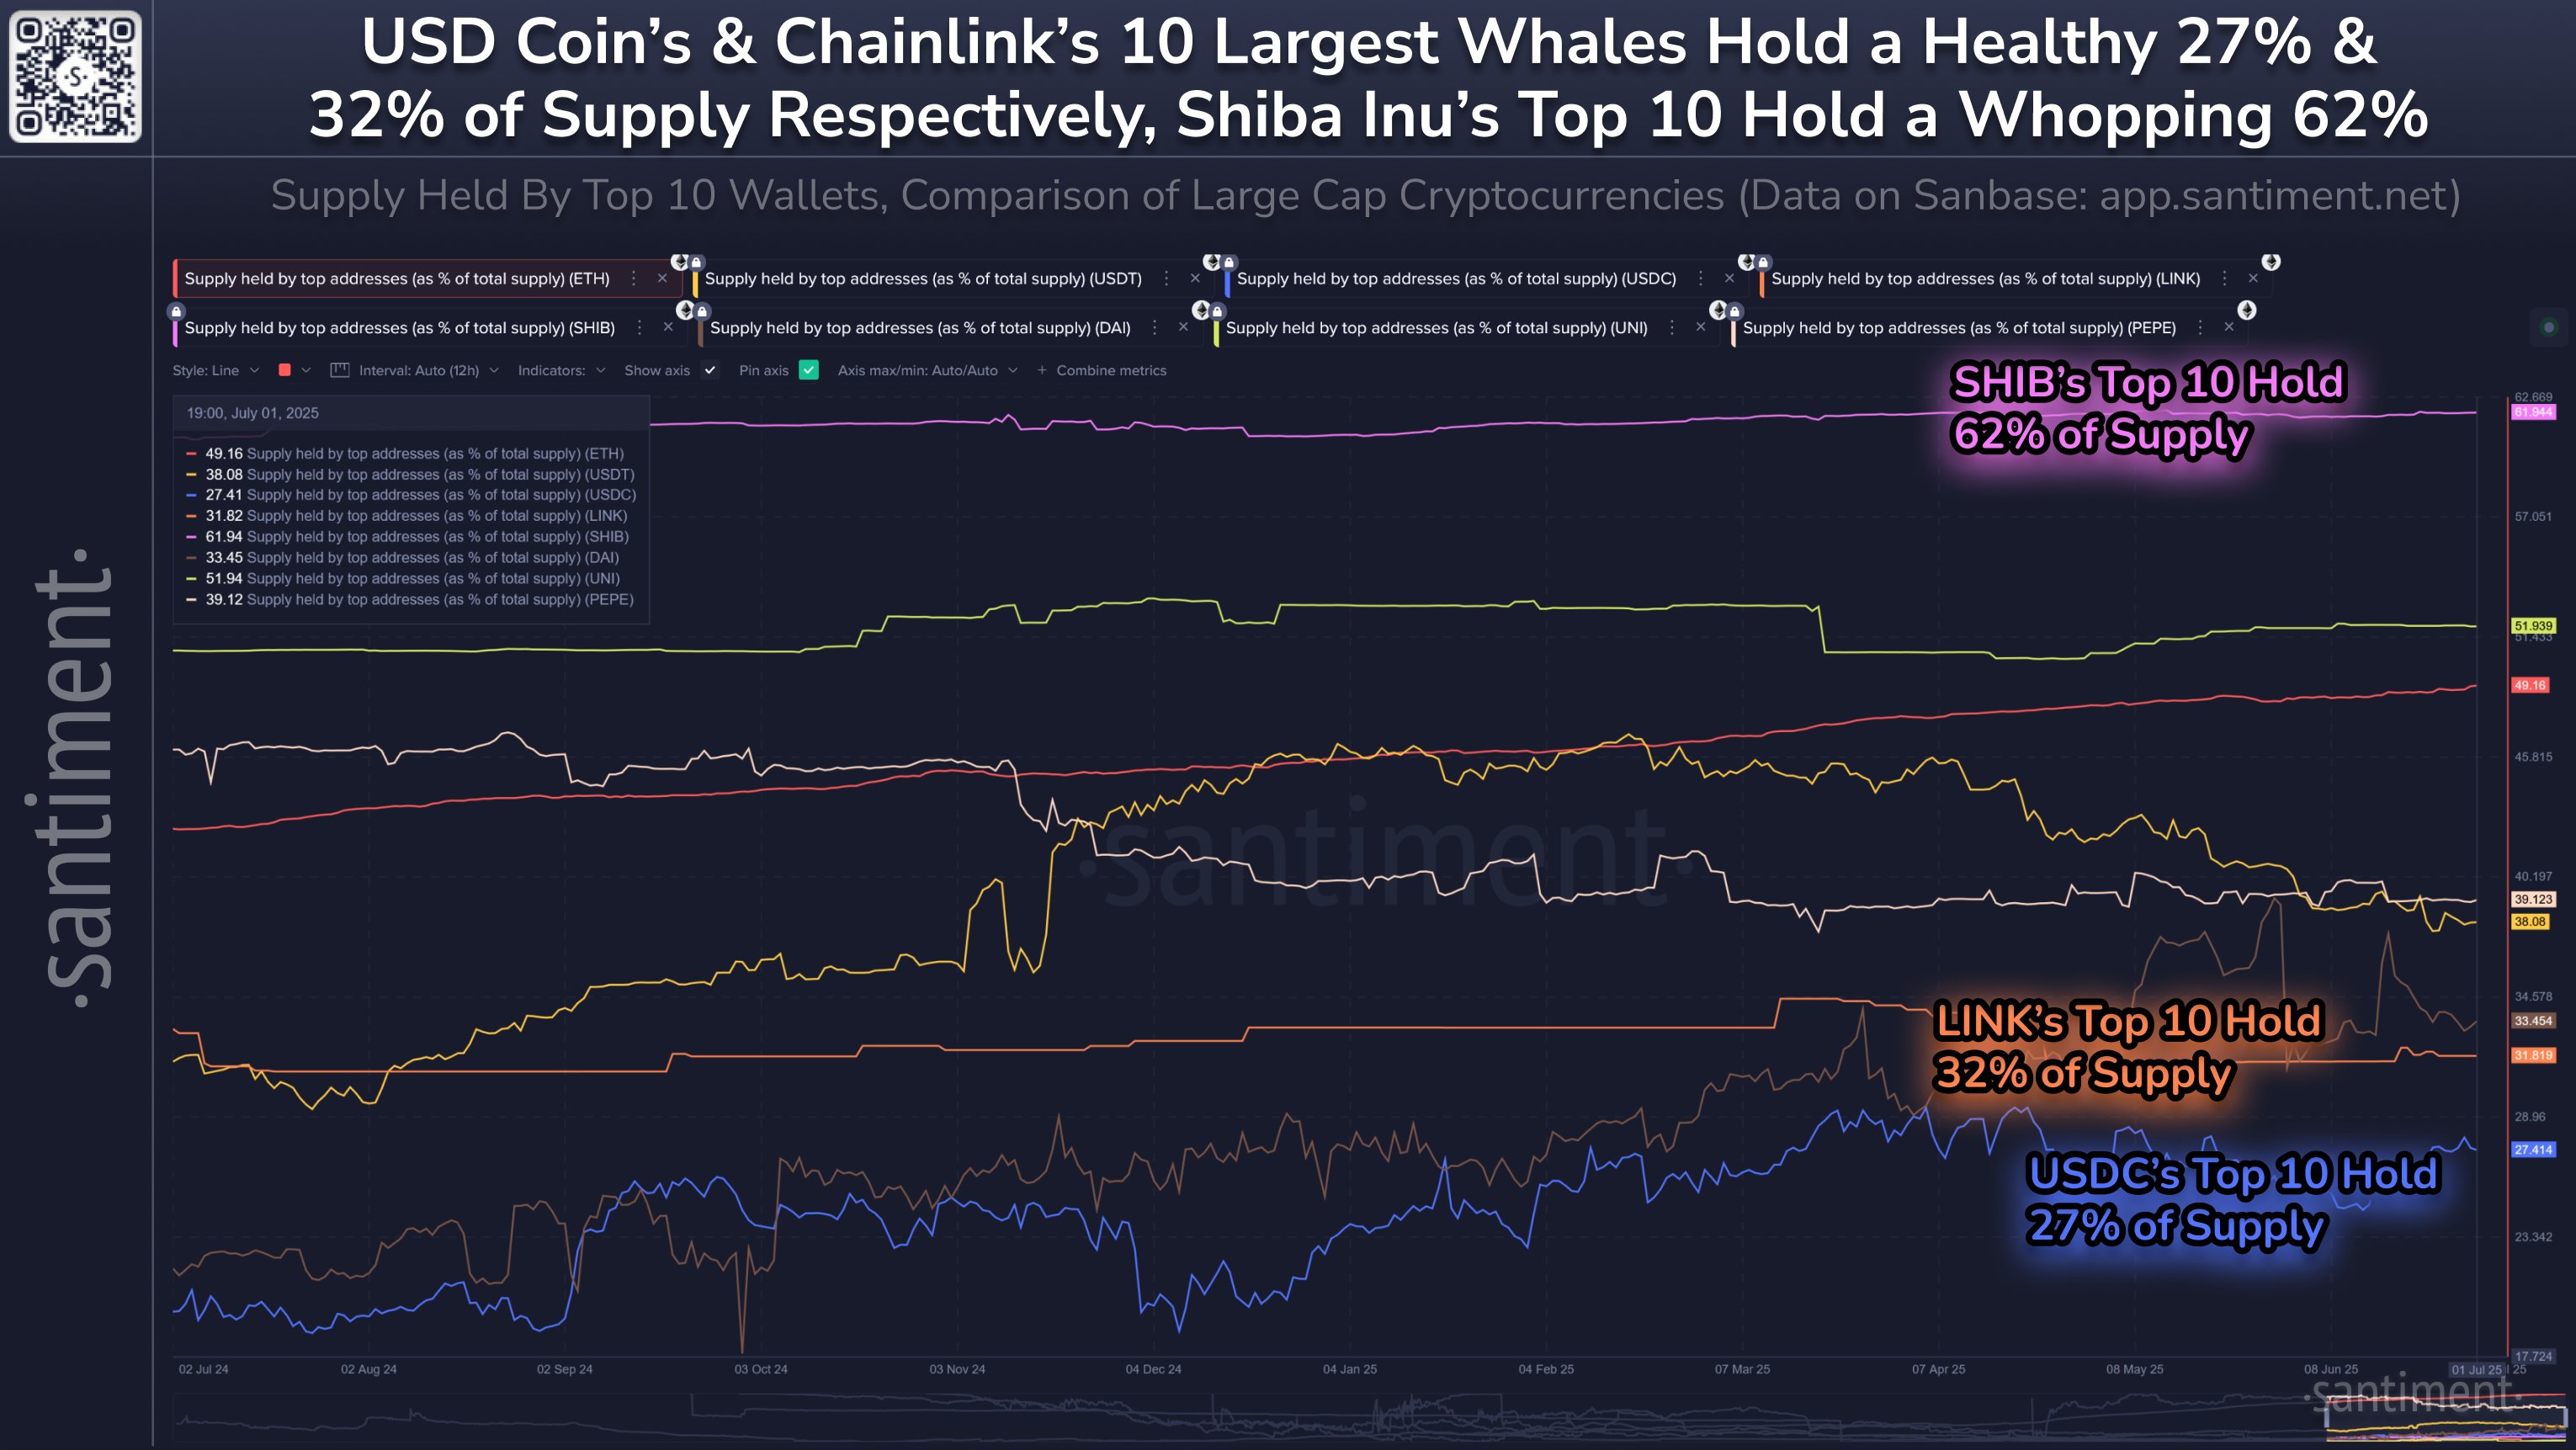
Shiba Inu Supply Most Centralized Among Top Coins—62% Held By Just 10 Whales
On-chain data shows Shiba Inu (SHIB) has its supply more concentrated on the largest holders than ot...