Bitcoin Price Holds Steady — Bullish Monthly Structure Suggests Rally Continuation


Bitcoin price started trading in a range below the $108,800 zone. BTC is now consolidating and might aim for a move above the $108,000 resistance.
- Bitcoin started a downside correction from the $108,800 zone.
- The price is trading below $107,500 and the 100 hourly Simple moving average.
- There is a bearish trend line forming with resistance at $107,400 on the hourly chart of the BTC/USD pair (data feed from Kraken).
- The pair could start a fresh increase if it stays above the $105,500 zone.
Bitcoin Price Eyes Fresh Gains
Bitcoin price started a fresh increase above the $105,500 zone. BTC gained pace and was able to climb above the $106,500 and $107,200 levels to enter a positive zone.
The bulls pushed the price above the $108,000 resistance and the price tested the $108,800 zone. A high was formed at $108,792 and the price recently corrected gains. There was a move below the $107,500 level. A low was formed at $106,800 and the price is now consolidating losses.
There was a recovery above the 23.6% Fib retracement level of the downward move from the $108,792 swing high to the $106,800 low. Bitcoin is now trading below $107,500 and the 100 hourly Simple moving average .
On the upside, immediate resistance is near the $107,400 level. There is also a bearish trend line forming with resistance at $107,400 on the hourly chart of the BTC/USD pair. The first key resistance is near the $108,000 level and the 50% Fib level of the downward move from the $108,792 swing high to the $106,800 low.
A close above the $108,000 resistance might send the price further higher. In the stated case, the price could rise and test the $108,800 resistance level. Any more gains might send the price toward the $110,000 level.
More Losses In BTC?
If Bitcoin fails to rise above the $108,000 resistance zone, it could start another decline. Immediate support is near the $106,800 level. The first major support is near the $106,500 level.
The next support is now near the $105,500 zone. Any more losses might send the price toward the $105,000 support in the near term. The main support sits at $103,500, below which BTC might gain bearish momentum.
Technical indicators:
Hourly MACD – The MACD is now losing pace in the bearish zone.
Hourly RSI (Relative Strength Index) – The RSI for BTC/USD is now below the 50 level.
Major Support Levels – $106,800, followed by $106,500.
Major Resistance Levels – $108,000 and $108,800.
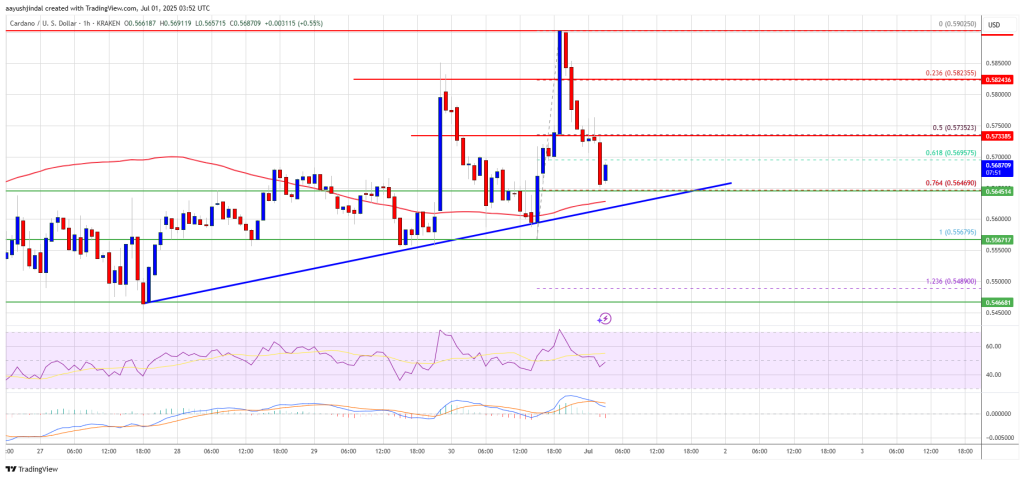
Cardano (ADA) Sideways — Support Intact, But No Spark for a Move Yet
Cardano price started a fresh decline from the $0.590 zone. ADA is now consolidating and might attem...
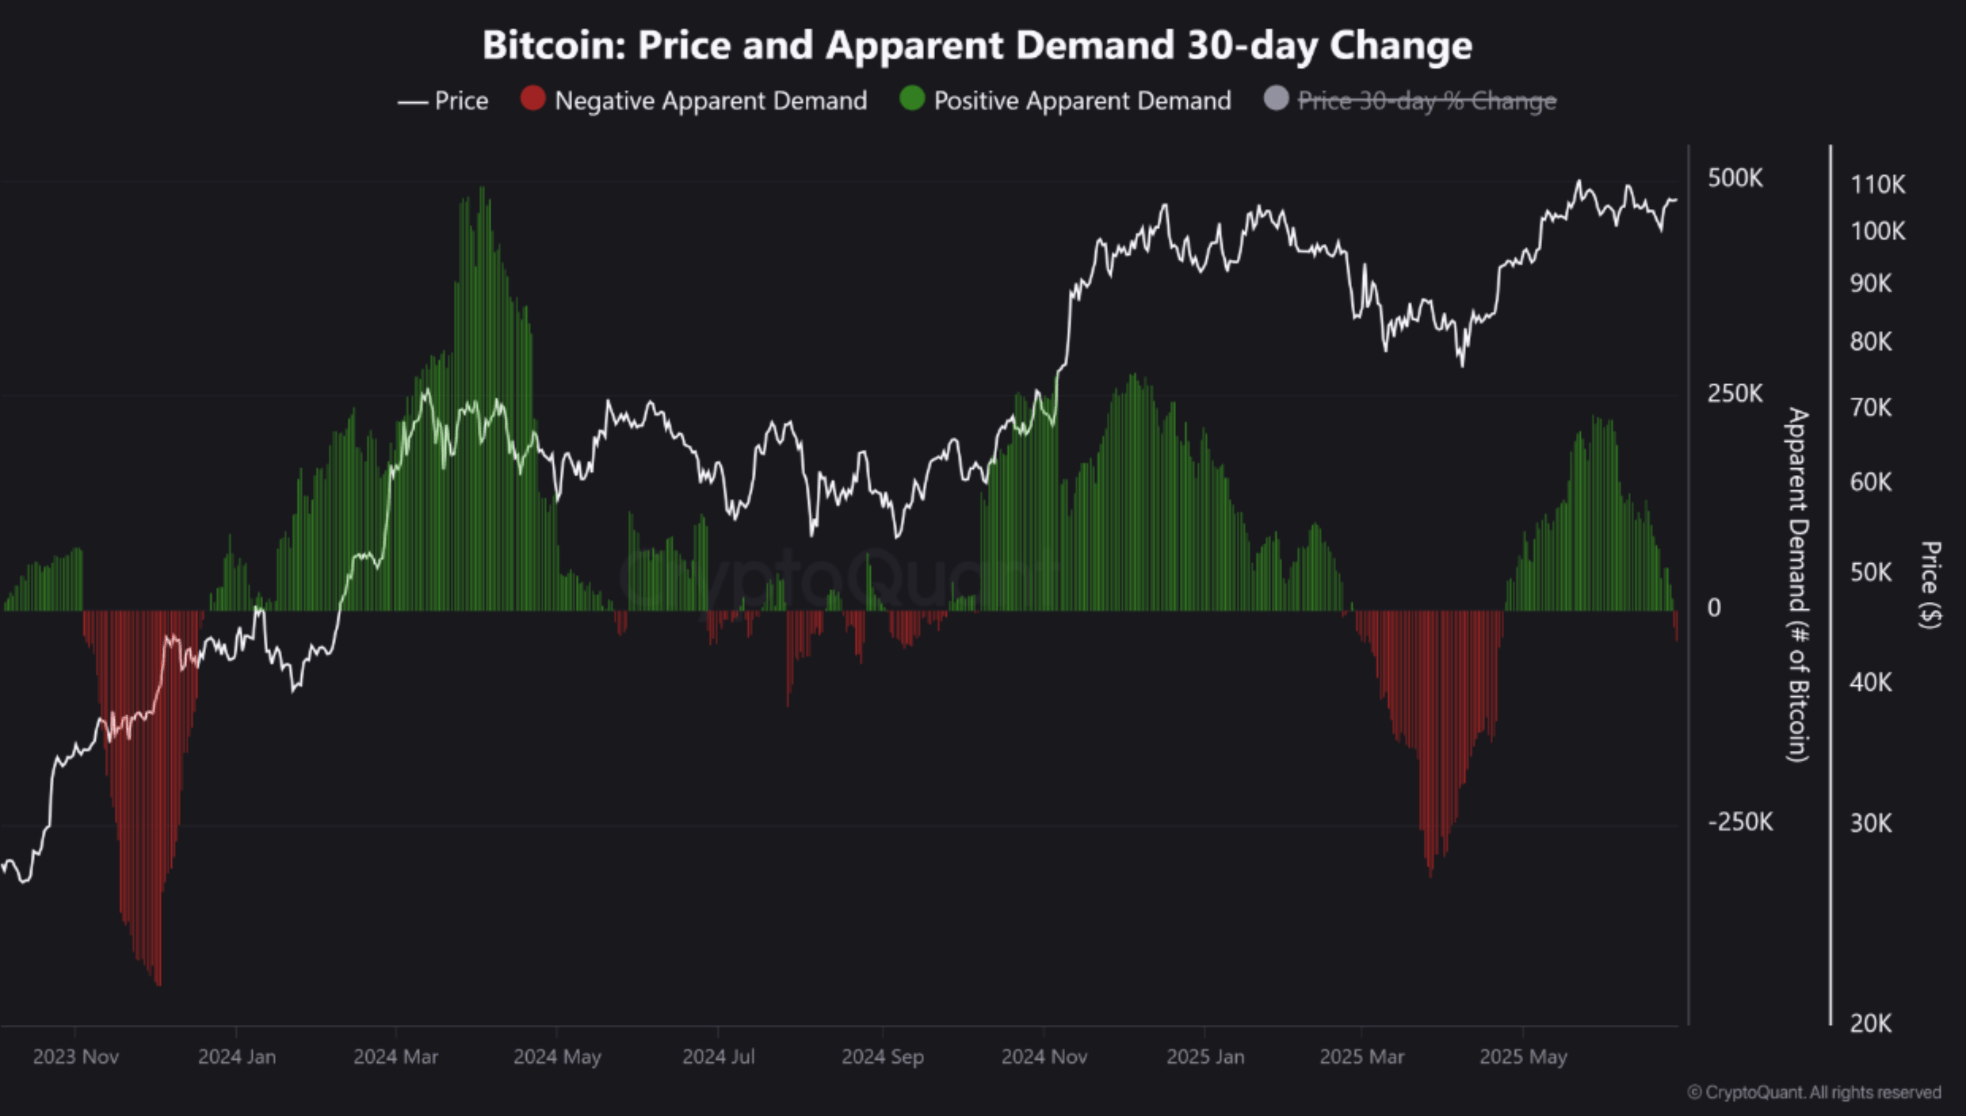
Bitcoin Market Enters Caution Zone Amid Rising Sell-Side Pressure, Analyst Says
Although Bitcoin (BTC) has recorded slight gains over the past month – up 3.6% in the last 30 days –...
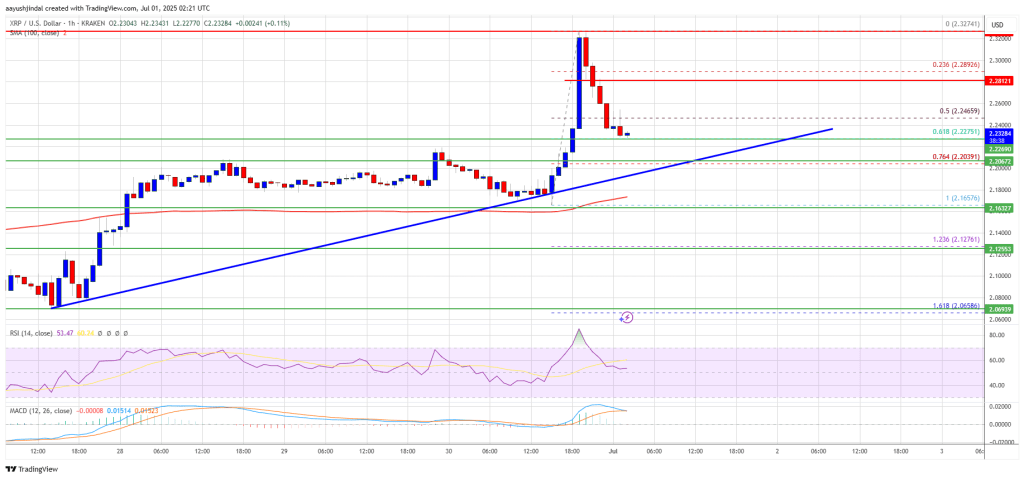
XRP Price Surges, Then Cools — Will Bulls Return for Round Two?
XRP price started a steady increase above the $2.220 zone. The price is now correcting gains and mig...