Dogecoin (DOGE) Eyes Upside After Crash, Yet Resistance Levels Cap Momentum


Dogecoin started a fresh decline from the $0.1720 zone against the US Dollar. DOGE is now consolidating losses and might recover if it clears $0.1580.
- DOGE price started a fresh decline below the $0.170 and $0.160 levels.
- The price is trading below the $0.160 level and the 100-hourly simple moving average.
- There was a break above a bearish trend line forming with resistance at $0.1510 on the hourly chart of the DOGE/USD pair (data source from Kraken).
- The price could start a fresh decline if it stays below the $0.1580 zone.
Dogecoin Price Faces Resistance
Dogecoin price started a fresh decline after it failed to clear the $0.1720 zone, underperforming Bitcoin and Ethereum . DOGE declined below the $0.1600 and $0.1580 levels.
The bears even pushed the price below the $0.1450 level. A low was formed at $0.1427 and the price is now attempting to recover. There was a minor move above the 23.6% Fib retracement level of the downward move from the $0.1718 swing high to the $0.1427 low.
Besides, there was a break above a bearish trend line forming with resistance at $0.1510 on the hourly chart of the DOGE/USD pair. Dogecoin price is now trading below the $0.1580 level and the 100-hourly simple moving average.
Immediate resistance on the upside is near the $0.1550 level. The first major resistance for the bulls could be near the $0.1580 level. It is close to the 50% Fib retracement level of the downward move from the $0.1718 swing high to the $0.1427 low.
The next major resistance is near the $0.1610 level. A close above the $0.1610 resistance might send the price toward the $0.1720 resistance. Any more gains might send the price toward the $0.200 level. The next major stop for the bulls might be $0.2120.
Another Decline In DOGE?
If DOGE’s price fails to climb above the $0.1580 level, it could start another decline. Initial support on the downside is near the $0.1480 level. The next major support is near the $0.1440 level.
The main support sits at $0.1420. If there is a downside break below the $0.1420 support, the price could decline further. In the stated case, the price might decline toward the $0.1350 level or even $0.1280 in the near term.
Technical Indicators
Hourly MACD – The MACD for DOGE/USD is now losing momentum in the bearish zone.
Hourly RSI (Relative Strength Index) – The RSI for DOGE/USD is now above the 50 level.
Major Support Levels – $0.1440 and $0.1420.
Major Resistance Levels – $0.1580 and $0.1610.
Crypto Bull Run Over? Here’s What A Top Trader Just Said
With Bitcoin precariously recovering above the $100,000 mark and altcoins bleeding momentum, traders...
Bitcoin Price Crash Far From Over As Support Sits Below $90,000 – Details
The Bitcoin price crash has been spurred on by looming war events as Iran and Israel continue to go ...
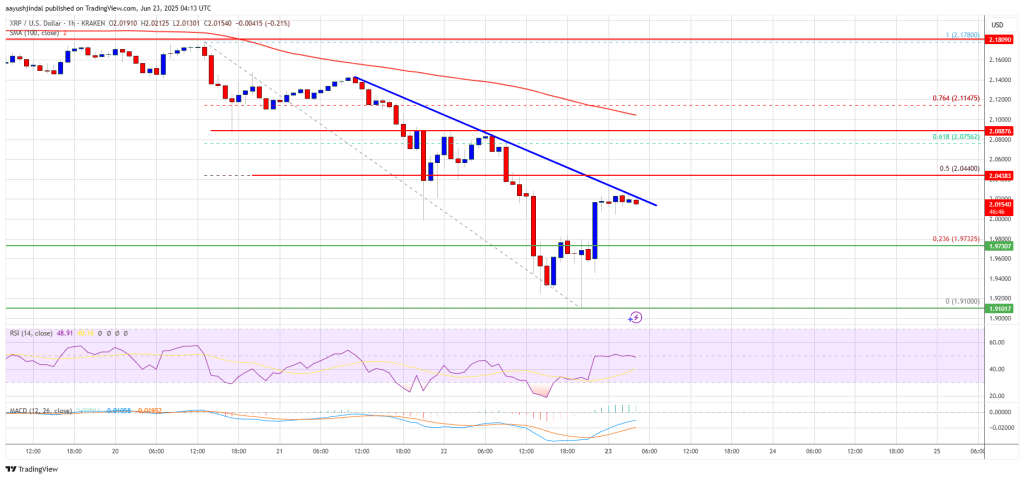
XRP Price Finds Some Relief, But Faces Headwinds on The Path Up
XRP price started a fresh decline below the $2.00 zone. The price is now correcting losses and faces...