Bitcoin Price Nosedives—Profit-Taking Sparks Sudden Correction


Bitcoin price started a fresh decline below the $105,500 zone. BTC is now consolidating and struggling to stay above the $103,200 support.
- Bitcoin started a fresh decline below the $106,500 and $105,500 levels.
- The price is trading below $106,500 and the 100 hourly Simple moving average.
- There is a key bearish trend line forming with resistance at $106,600 on the hourly chart of the BTC/USD pair (data feed from Kraken).
- The pair could start a fresh recovery wave if it clears the $105,500 resistance zone.
Bitcoin Price Dips Sharply
Bitcoin price started a fresh decline after it failed to clear the $110,500 resistance zone . BTC declined below the $107,500 and $106,500 support levels.
The price even dipped below the $104,200 support level. Finally, it tested the $103,000 zone. A low was formed at $103,078 and the price is now consolidating losses below the 23.6% Fib level of the recent decline from the $110,273 swing high to the $103,078 low.
Bitcoin is now trading below $105,500 and the 100 hourly Simple moving average . There is also a key bearish trend line forming with resistance at $106,600 on the hourly chart of the BTC/USD pair.
On the upside, immediate resistance is near the $104,200 level. The first key resistance is near the $105,500 level. The next key resistance could be $106,600 and the 50% Fib retracement level of the recent decline from the $110,273 swing high to the $103,078 low.
A close above the $106,600 resistance might send the price further higher. In the stated case, the price could rise and test the $108,000 resistance level. Any more gains might send the price toward the $110,000 level.
More Losses In BTC?
If Bitcoin fails to rise above the $105,500 resistance zone, it could start another decline. Immediate support is near the $103,000 level. The first major support is near the $102,350 level.
The next support is now near the $101,500 zone. Any more losses might send the price toward the $100,500 support in the near term. The main support sits at $100,000, below which BTC might gain bearish momentum.
Technical indicators:
Hourly MACD – The MACD is now gaining pace in the bearish zone.
Hourly RSI (Relative Strength Index) – The RSI for BTC/USD is now below the 50 level.
Major Support Levels – $103,000, followed by $102,350.
Major Resistance Levels – $104,200 and $105,500.

Shiba Inu Goes Serious: Shib Alpha Layer Marks End Of Meme Era
The Shiba Inu development crew has rolled out a new tech layer that could shift how people use SHIB....
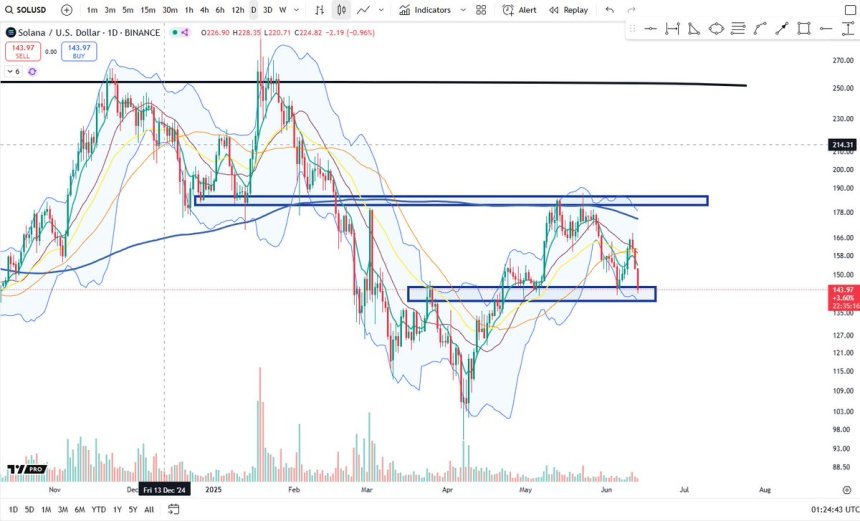
Solana Approaches Critical Support Amid Middle East Conflicts – Can Demand Hold?
After a volatile but bullish start to June, Solana (SOL) is now facing strong selling pressure amid ...
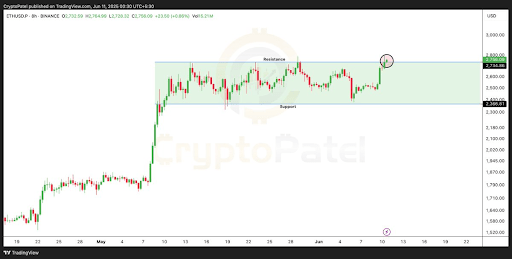
Ethereum Price Could Rally To $10,000 If This Major Resistance Is Broke
Ethereum’s price action this week has been very notable, with the leading altcoin breaking above $2,...