Dogecoin (DOGE) Consolidates Losses — Can Meme Coin Mania Make a Comeback?


Dogecoin started a fresh decline from the $0.2250 zone against the US Dollar. DOGE is now consolidating losses and might recover if it clears $0.20.
- DOGE price started a fresh decline below the $0.220 and $0.20 levels.
- The price is trading below the $0.20 level and the 100-hourly simple moving average.
- There is a connecting bullish trend line forming with support at $0.1910 on the hourly chart of the DOGE/USD pair (data source from Kraken).
- The price could start a fresh increase if it clears the $0.20 resistance zone.
Dogecoin Price Holds Support
Dogecoin price started a fresh decline after it failed to clear the $0.2450 zone, unlike Bitcoin and Ethereum . DOGE declined below the $0.220 and $0.20 levels.
The bears even pushed the price below the $0.1920 level. A low was formed at $0.1855 and the price is now consolidating losses. There was a minor increase above the 23.6% Fib retracement level of the downward move from the $0.2279 swing high to the $0.1855 low.
Dogecoin price is now trading below the $0.20 level and the 100-hourly simple moving average. There is also a connecting bullish trend line forming with support at $0.1910 on the hourly chart of the DOGE/USD pair.
Immediate resistance on the upside is near the $0.20 level. The first major resistance for the bulls could be near the $0.2060 level. It is close to the 50% Fib retracement level of the downward move from the $0.2279 swing high to the $0.1855 low.
The next major resistance is near the $0.2120 level. A close above the $0.2120 resistance might send the price toward the $0.2250 resistance. Any more gains might send the price toward the $0.2340 level. The next major stop for the bulls might be $0.250.
More Losses In DOGE?
If DOGE’s price fails to climb above the $0.20 level, it could start another decline. Initial support on the downside is near the $0.1910 level and the trend line. The next major support is near the $0.1850 level.
The main support sits at $0.1720. If there is a downside break below the $0.1720 support, the price could decline further. In the stated case, the price might decline toward the $0.1650 level or even $0.1550 in the near term.
Technical Indicators
Hourly MACD – The MACD for DOGE/USD is now losing momentum in the bearish zone.
Hourly RSI (Relative Strength Index) – The RSI for DOGE/USD is now above the 50 level.
Major Support Levels – $0.1910 and $0.1855.
Major Resistance Levels – $0.2000 and $0.2060.
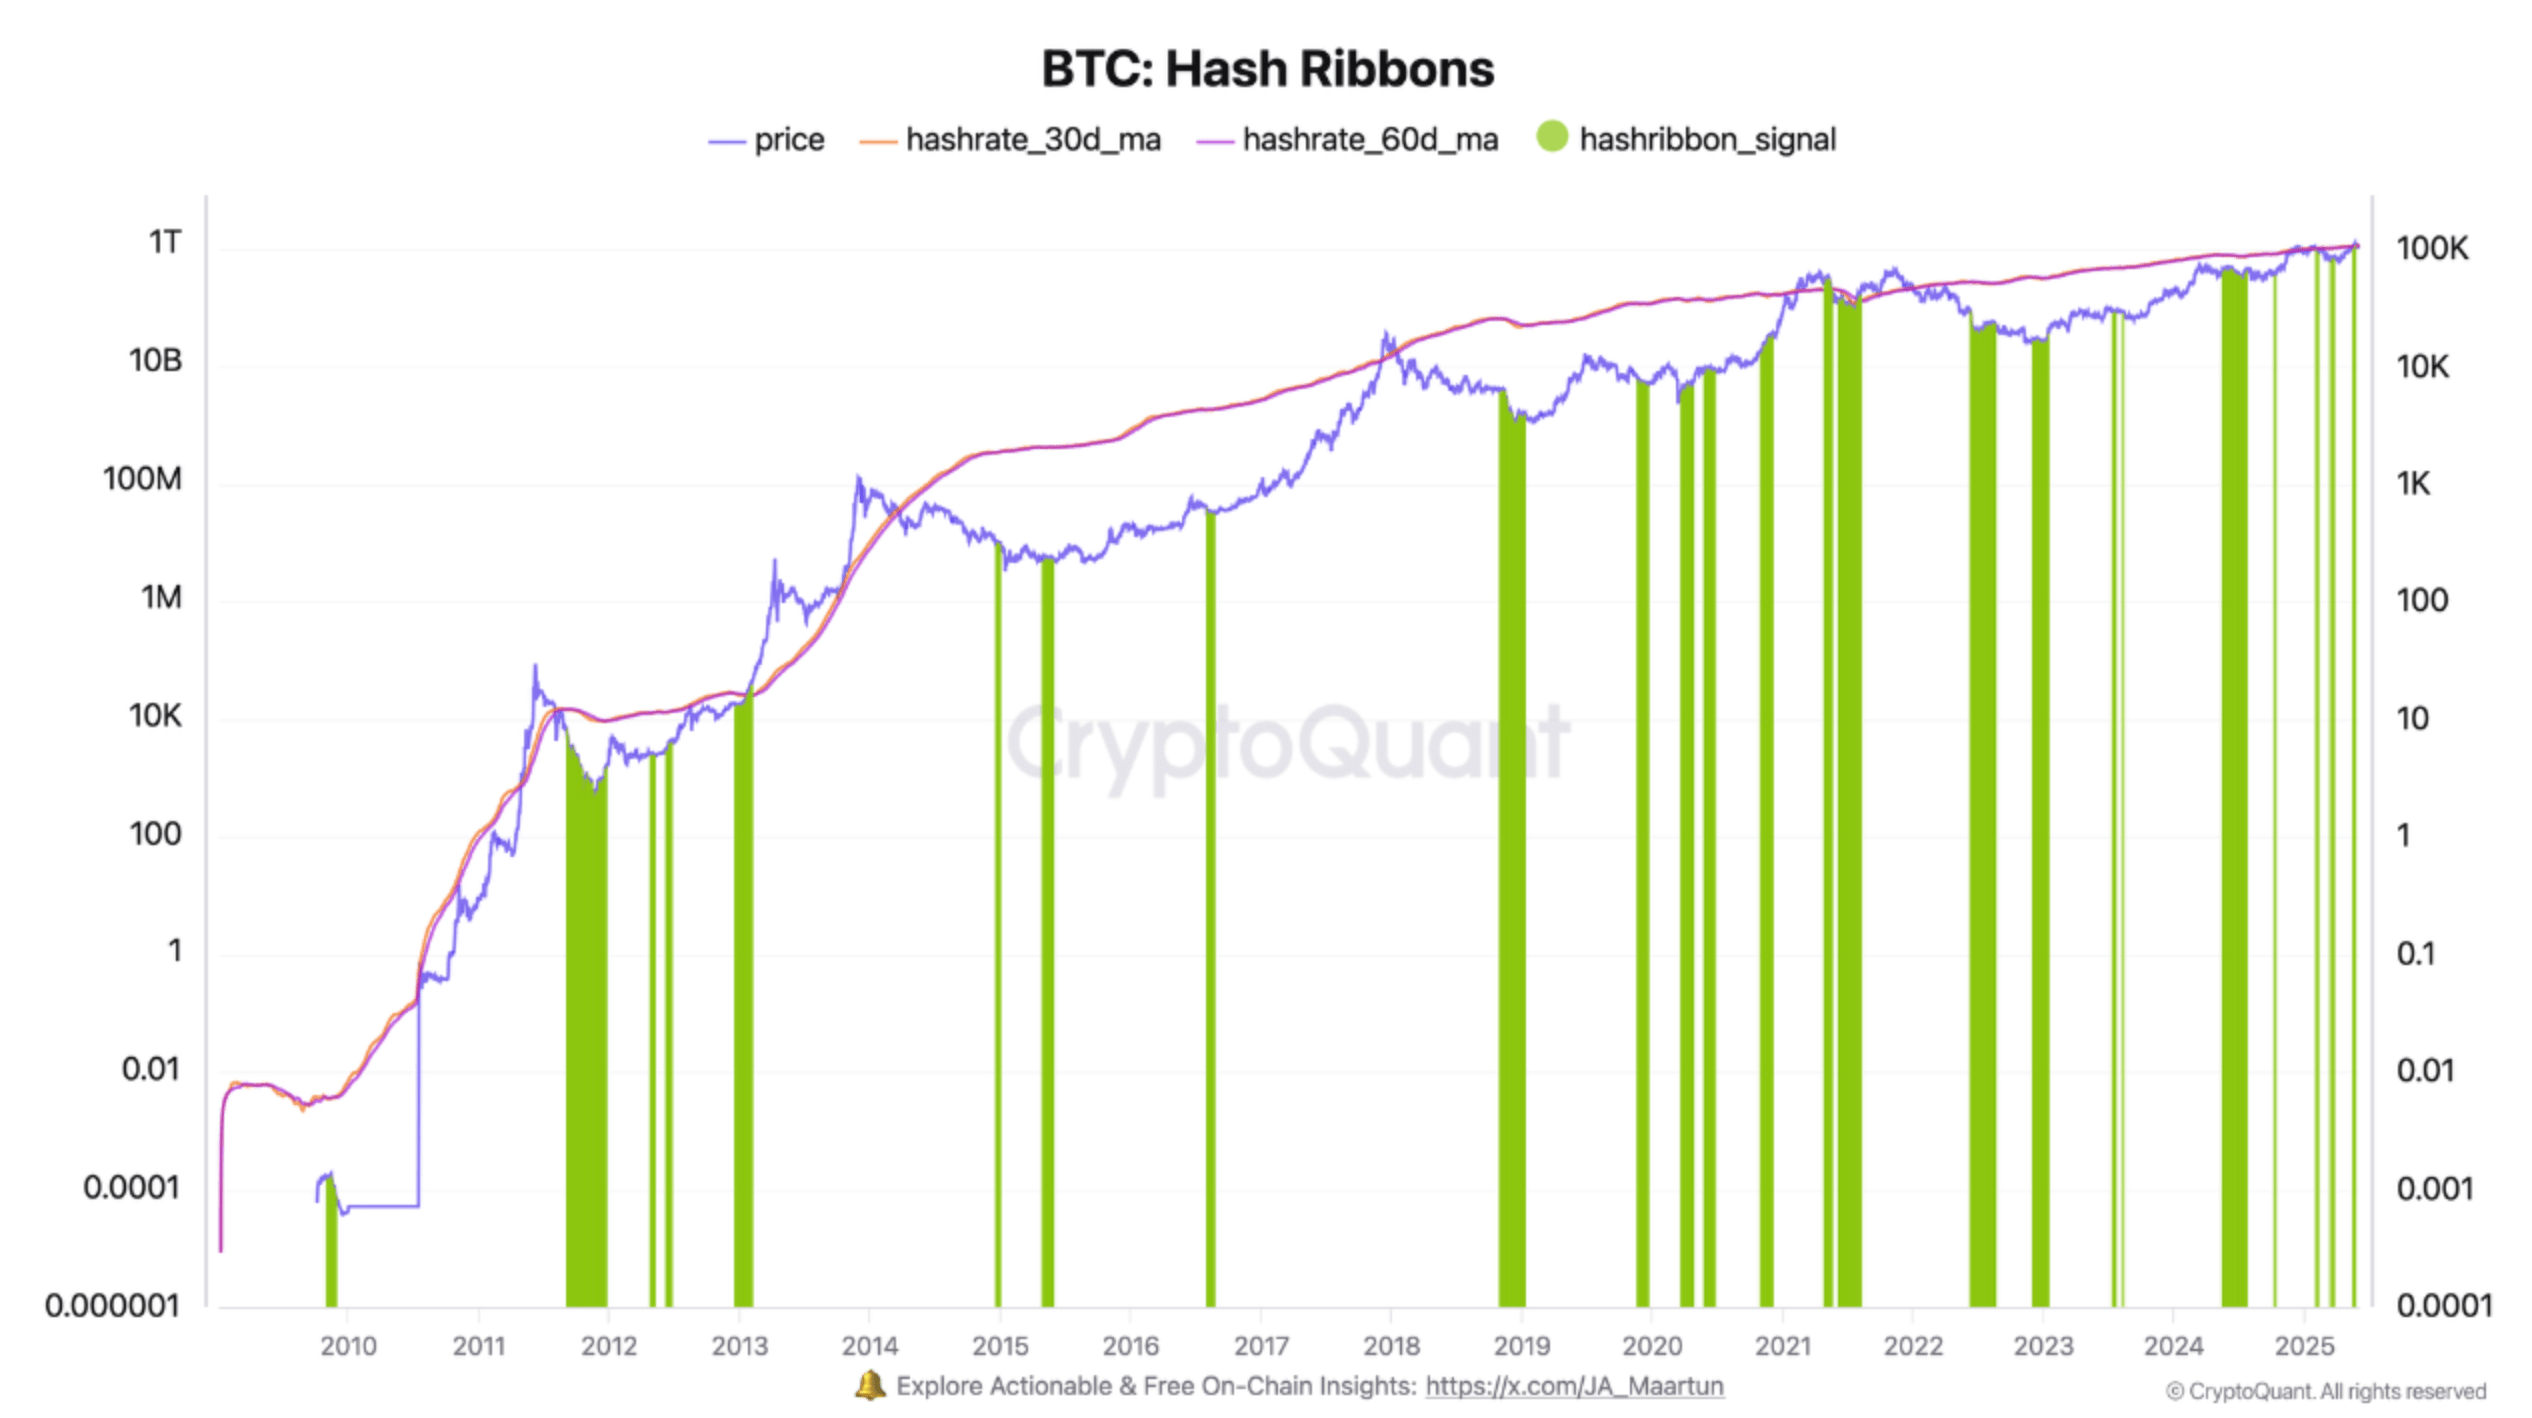
Bitcoin Hash Ribbons Indicating Prime Buying Opportunity, Analyst Says
Bitcoin (BTC) remains range-bound in the mid-$100,000s, showing no clear directional bias. However, ...

Messari Flags XRP’s Silent Rise As A Treasury Favorite—Here’s Why
Three publicly traded companies are moving to hold XRP as part of their cash stash, putting real mon...
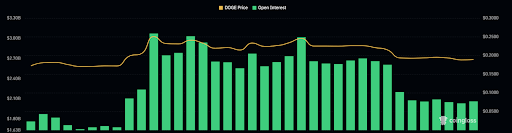
Dogecoin Open Interest Averages $2 Billion In June As Price Struggles Below $0.2
Dogecoin’s open interest is in focus, with this crucial metric highlighting the amount of interest t...