Ethereum Daily Gas Usage Hits New Highs – Real Demand Powers ETH Growth


Ethereum is experiencing increased volatility as it consolidates just below the key $2,700 resistance level. Despite several attempts to break above it in recent weeks, ETH has yet to secure a daily close above this threshold, making it a crucial battleground for bulls and bears alike. The broader market remains uncertain, but Ethereum’s fundamentals continue to show strength beneath the surface.
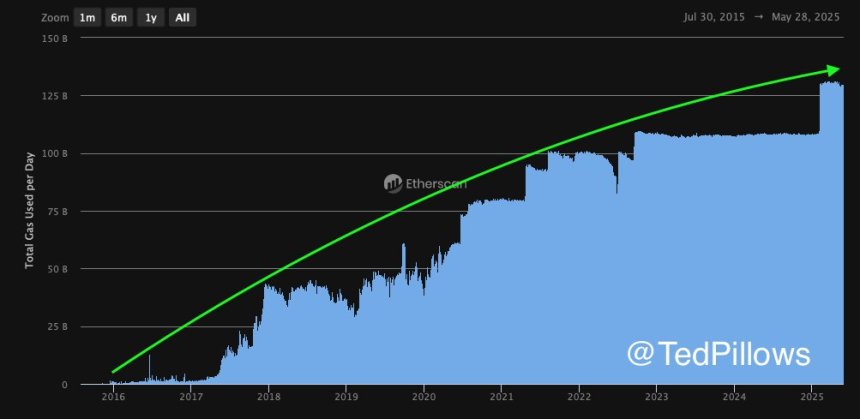
Top analyst Ted Pillows shared compelling insights on X, highlighting that Ethereum’s daily gas usage has been climbing steadily since 2016. This long-term rise suggests that Ethereum’s network activity is not just driven by short-term speculation or hype, but by real and growing demand. It’s a sign that users, developers, and applications are increasingly relying on ETH as the backbone of Web3 infrastructure.
Ethereum’s ability to maintain this level of on-chain usage through bear and bull markets reinforces its role as the foundation of decentralized finance, NFTs, and smart contracts. While short-term price action remains capped below $2,700, the underlying demand tells a bullish story. If ETH can break above this level with conviction, it may signal the beginning of a broader move to retest higher resistance levels.
Ethereum Fundamentals Are Strong As It Prepares For A Move
Ethereum is facing a critical test as it consolidates below major resistance, struggling to reclaim key levels above the $2,700 mark. Bulls have maintained strong support over the past few sessions, but momentum has yet to trigger a breakout. As global tensions remain high and US Treasury yields continue to rise, risk assets—including cryptocurrencies—are under pressure. However, Ethereum appears poised for an expansive move, with technical and on-chain data supporting a potential breakout.
Pillows highlighted that Ethereum’s daily gas usage has continued to climb steadily since 2016, reinforcing the view that ETH demand is structural and not just a product of market hype. This metric serves as a proxy for real activity on the Ethereum network, suggesting that despite short-term price hurdles, usage and value creation persist. Pillows believes this persistent demand positions ETH for a strong recovery once key technical levels are breached.
Sentiment across the broader crypto space is gradually shifting bullish, especially with Bitcoin hovering near its all-time high. If Ethereum can reclaim and close above the $2,700–$2,800 resistance zone, it could open the door for a sharp rally toward $3,000 and beyond.
ETH Consolidates Below Key Resistance
Ethereum is currently trading at $2,617, consolidating just below the critical $2,700–$2,800 resistance zone. This area has acted as a major barrier since early February, and despite several breakout attempts, ETH has failed to close above it with strong conviction. The chart shows a clear bullish structure, with the price holding above key moving averages: the 34 EMA at $2,366, and the 50, 100, and 200 SMAs all trending upward and providing layered support between $2,070 and $2,690.

The recent consolidation comes after a strong rally in May that pushed ETH above its 200-day SMA for the first time in months, signaling a major shift in momentum. However, volume has started to taper off slightly, which could indicate hesitation from bulls at current levels. A decisive daily close above $2,800 would likely confirm the breakout and open the door for a move toward the $3,000–$3,200 range.
Until then, the price remains range-bound, with $2,550 acting as near-term support. If ETH can maintain this level and continue forming higher lows, the bullish thesis remains intact. All eyes are now on whether Ethereum can break through the ceiling that has capped it for weeks, and potentially kickstart a broader altcoin rally.
Featured image from Dall-E, chart from TradingView
Can Dogecoin Price Still Rally 1,000%? Analyst Reveals End-Of-Year Prediction
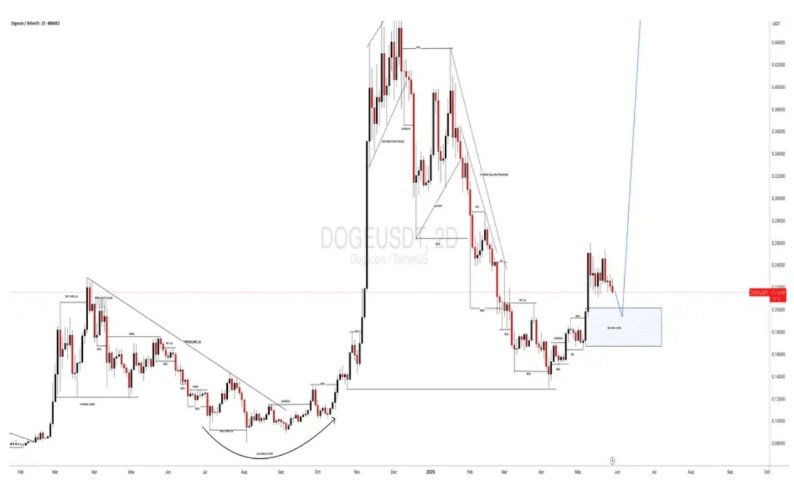
A crypto analyst has forecasted a potential 1,000% rally for the Dogecoin price by the end of the ye...
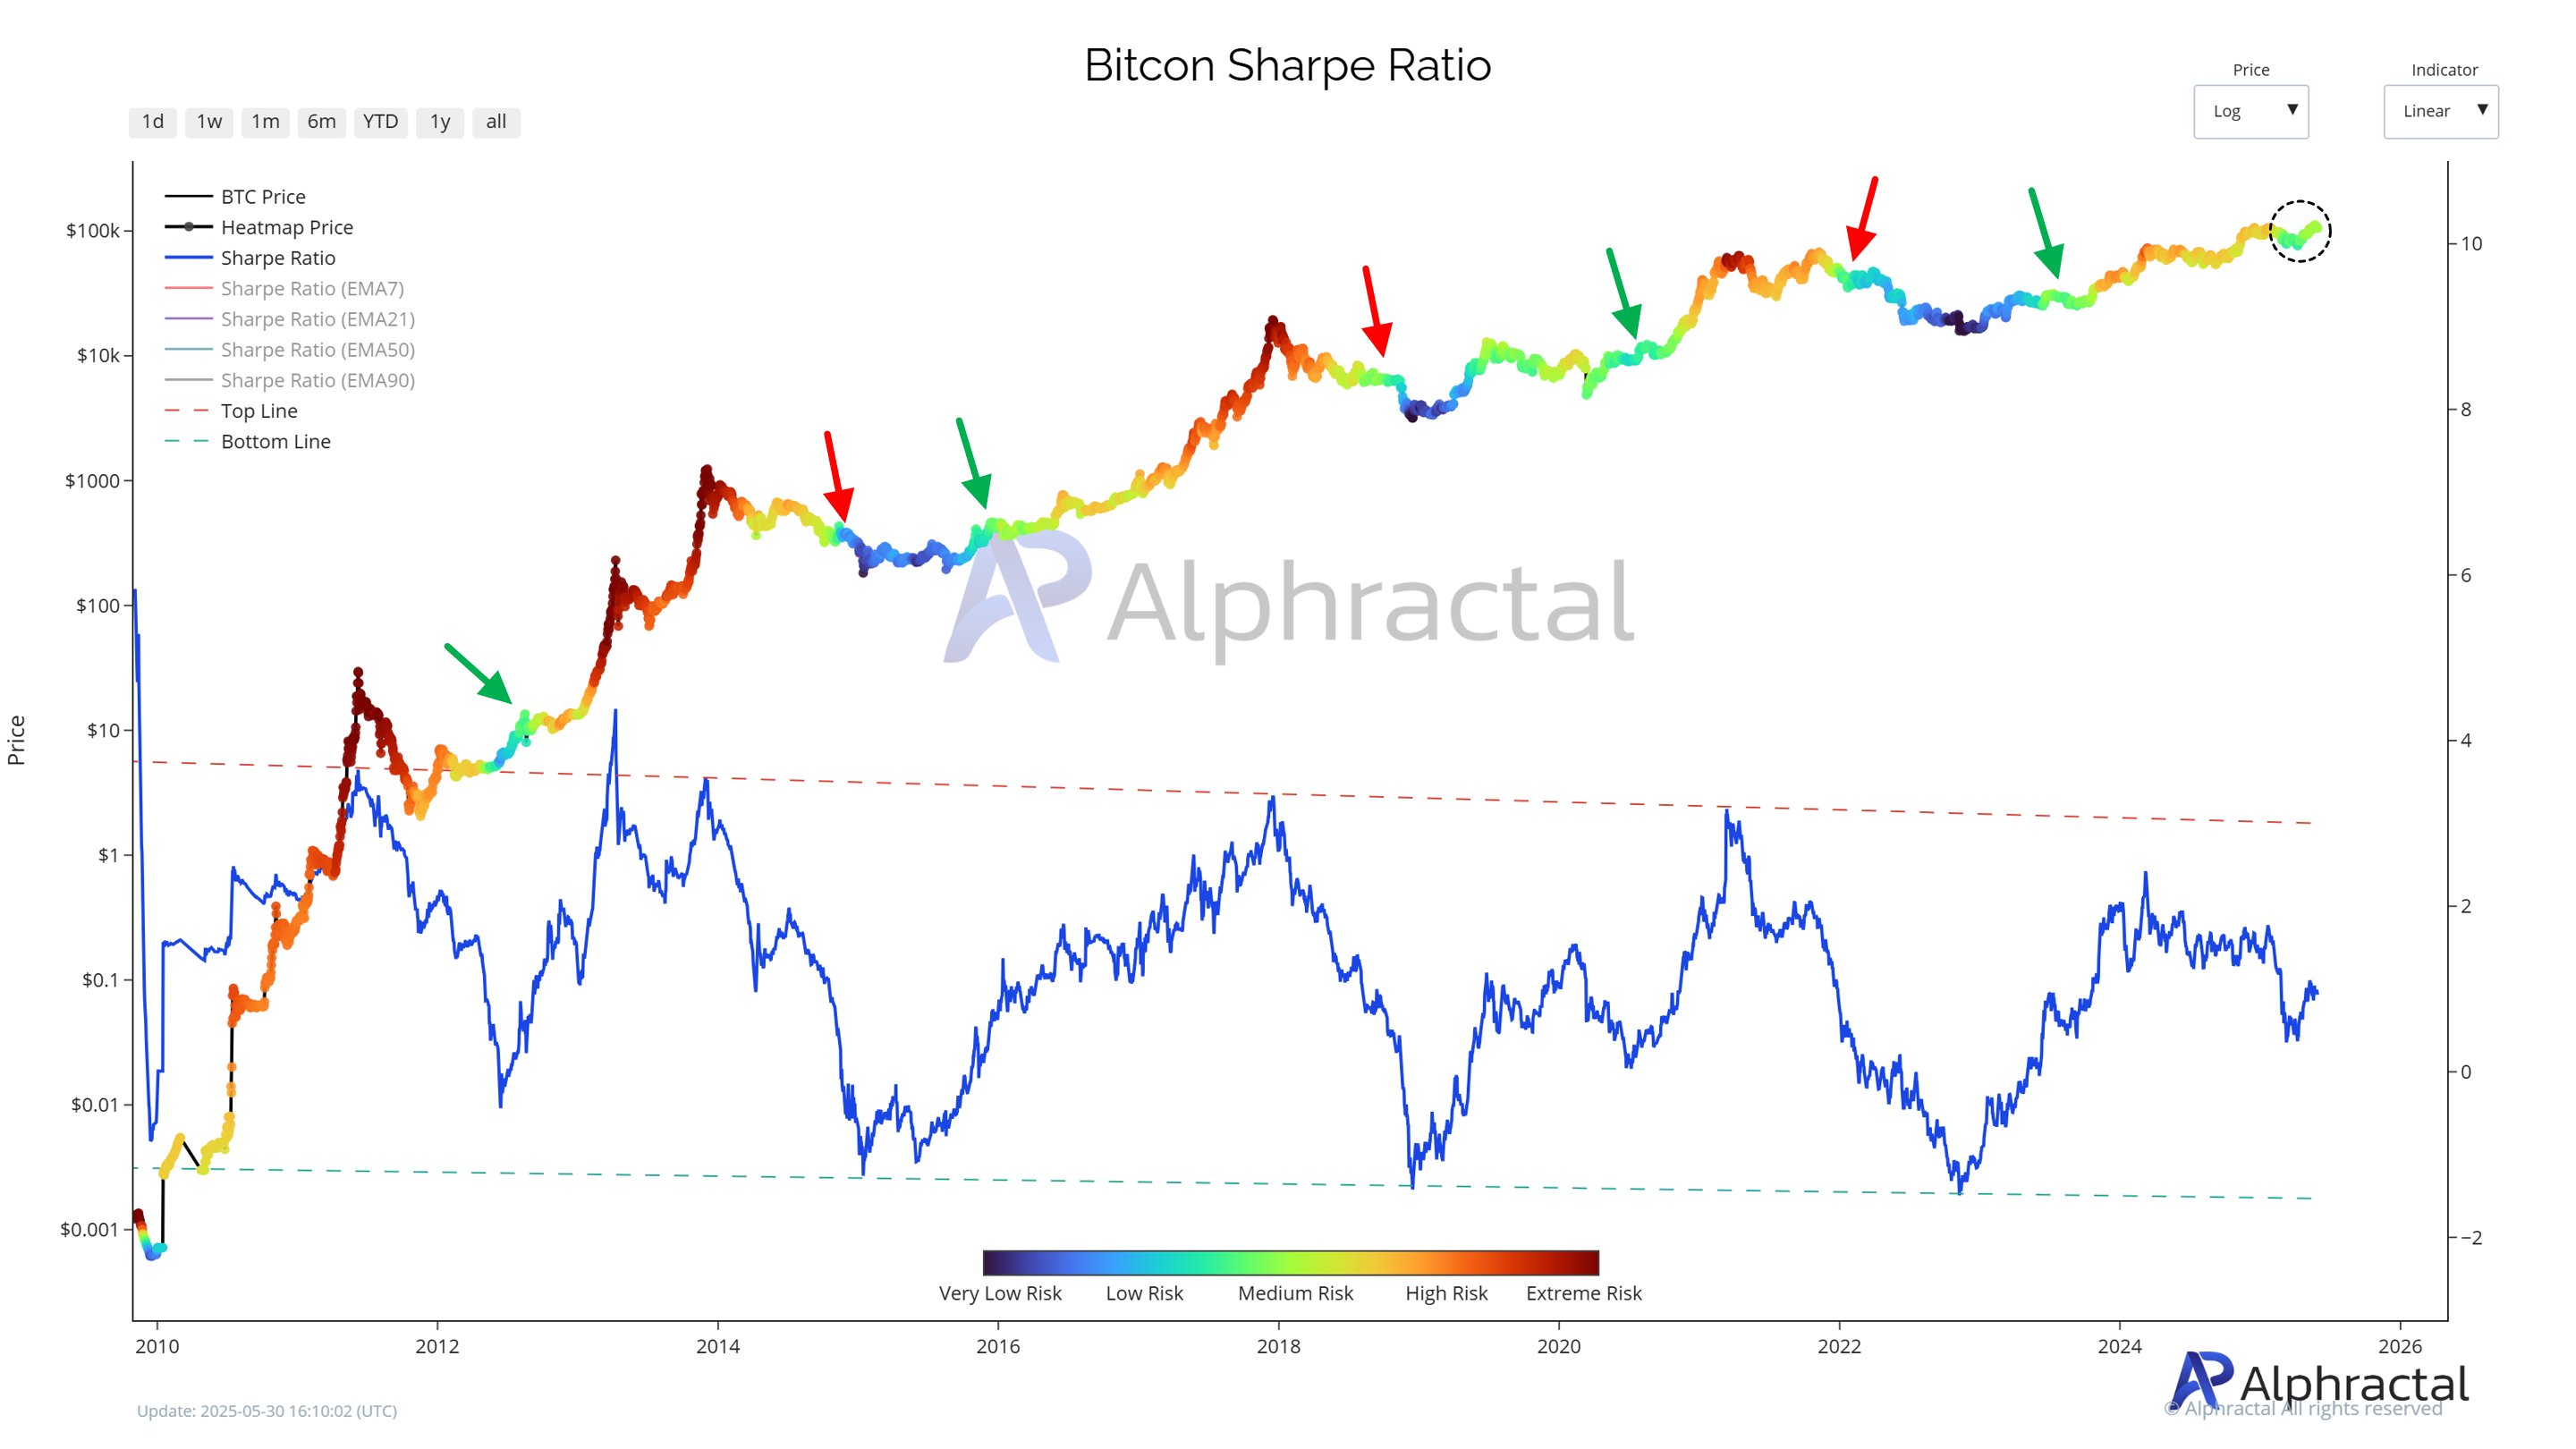
Bitcoin Sharpe Ratio Says It’s Time For ‘Cautious Optimism’ — Further Upside Growth Incoming?
The price of Bitcoin has dropped by nearly 4% over the last seven days, indicating the waning bullis...
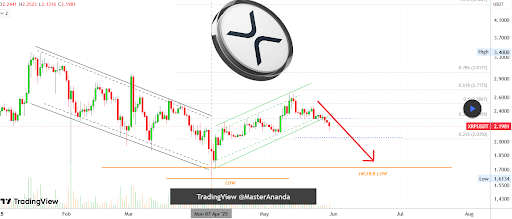
XRP Price Risks Crash Below $2 As Correction Takes Hold, Here’s Why
The recent price action for XRP has shown little sign of strength as the crypto is now battling sust...