XRP Bull Flag Targets $18: Analyst Sees 70% Chance Of Breakout


Independent market technician EGRAG CRYPTO posted an updated weekly XRP/USD chart on X. The visual, built on Bitfinex data, frames the entire post-July 2024 advance by XRP as the flag-pole of a classic bull-flag continuation pattern and argues that the subsequent ten-week drift has traced out a near-textbook, downward-slanted consolidation channel whose upper and lower rails are highlighted in magenta.
XRP Poised For Breakout
“The success rate of breaking upwards is around 67–70 percent,” the analyst writes , citing bulk pattern-recognition studies that underpin the set-up’s statistical edge. XRP is trading near $2.30, a value marked on the chart by a blue dotted horizontal line intersecting the body of the flag.
Beneath that, a white line at $1.50 records the late-2024 breakout shelf that now functions as first higher-time-frame support, while a deeper red horizontal at roughly $0.60 flags the base from which the current cycle began. Threading up through the entire structure is a rising yellow moving average—visually consistent with the 20-week EMA (currently at $2.21)—underscoring what Egrag calls the market’s “still-positive long-term trend bias.”
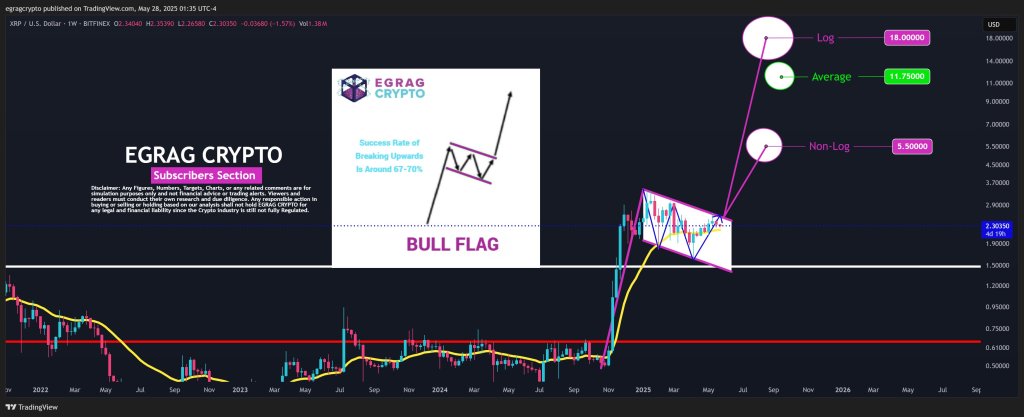
From that foundation the technician derives three measured-move objectives. “For long-term breakouts I prefer logarithmic charts, especially in crypto, because of its exponential growth over short periods,” he explained. On that basis a log-scale projection extrapolates the full height of the flag-pole and lands at $18.00. A linear projection, which treats each dollar of advance equally, prints a markedly lower $5.50. Taking what he describes as a “liquidity-adjusted average — my preferred method for crypto targets,” Egrag settles on $11.75.
Because digital-asset order books remain relatively thin, the analyst overlays a variability band of fifteen to twenty percent, stretching the log target to roughly $20.70–$21.60, the average to $13.51–$14.10 and the linear to $6.33–$6.60. “I usually apply a 15–20 percent variability because crypto liquidity is still smaller compared to legacy markets, so targets can extend both ways,” he cautioned.
A disclaimer printed directly on the graphic reiterates that the numbers and targets are “for simulation purposes only and not financial advice.” Even so, the roadmap is clear for Egrag: so long as XRP defends the mid-flag zone near $2.30 and, critically, the structural pivot at $1.50, the technician contends that an eventual breakout could vault the token into double-digit territory , with the headline log objective sitting just beneath the psychologically resonant $20 handle.
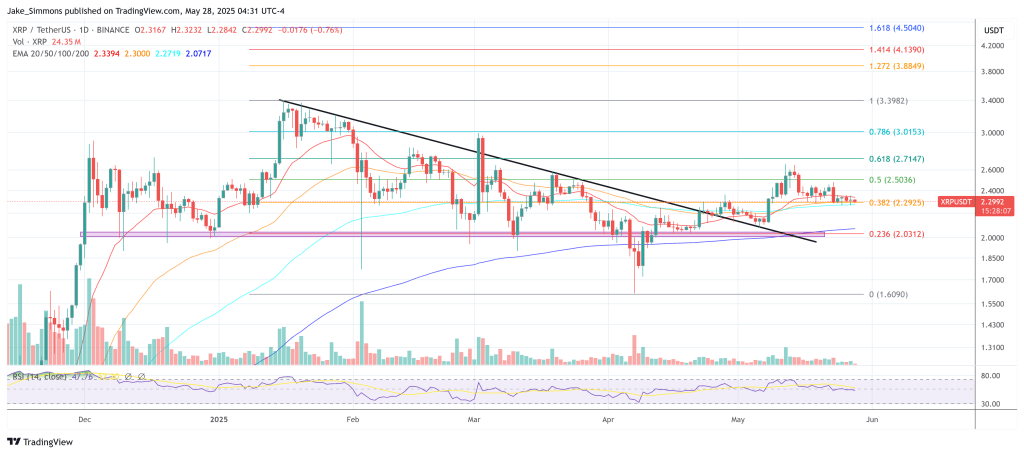
At press time, XRP traded at $2.28, still hovering just below the upper trendline of the bull flag . A close above the resistance could accelerate the XRP price quickly towards the 0.5 and 0.618 Fibonacci retracement levels at $2.50 and $2.71 respectively.
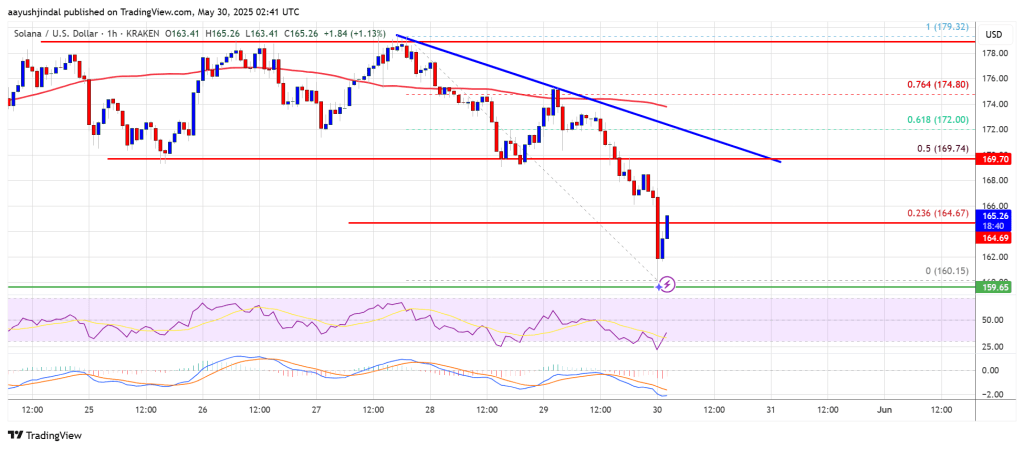
Solana (SOL) Faces Renewed Selling — Will Support Levels Hold?
Solana started a fresh decline from the $180 zone. SOL price is now moving lower and might decline f...
Bitcoin Rally Stalls at $108K as Key Risk Metric Flashes Red, Is Correction Looming?
Bitcoin (BTC) has recently experienced a slight slowdown after its impressive upward run, trading at...
XRP Price Slips Again — Is a Deeper Correction Underway?
XRP price started a fresh decline below the $2.280 zone. The price is now correcting losses and migh...