Bitcoin Risk Signal Drops to Rare Low, Echoes Conditions Last Seen in 2016


- Bitcoin’s risk level nears rare lows, echoing pre-bull market signals from 2016 and 2018.
- CryptoQuant model shows few correction warnings, indicating strong investor confidence.
- Risk-Off Signal suggests current market phase may offer a strategic entry for long-term holders.
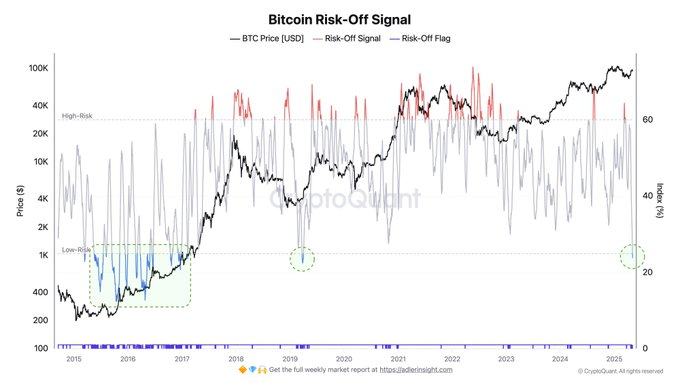
A basic risk model tracking Bitcoin’s market dynamics has entered a rare low zone, signaling conditions similar to those observed ahead of previous major bull runs. According to recent data from CryptoQuant, the “Bitcoin Risk-Off Signal” model suggests that current risk levels are among the lowest recorded in the past decade.
The Bitcoin Risk-Off Signal evaluates market risk using six weighted inputs from on-chain and exchange-based metrics. These include trading behaviors, investor positioning, and systemic flow patterns.
The model displays its readings through a risk oscillator, where values above 60 typically flag high correction risks, and those below 20 reflect low-risk conditions. When the oscillator turns red, it indicates market fragility, but a blue reading near or below 20 signals the potential for a bullish trend with limited downside volatility.

As of early May 2025, the oscillator is nearing the 20% mark, which has only been breached a few times over the last ten years. CryptoQuant’s chart marks the development with a green dashed circle, indicating that Bitcoin may be in a rare, historically favorable market phase.
Pattern Mirrors 2016 Bull Market Entry
Past readings below the 20% level often align with major accumulation phases. Notably, similar setups were observed between late 2015 and early 2017 and briefly during the final months of 2018. These periods preceded upward momentum in Bitcoin’s price, especially as long-term holders increased their positions.
The current chart overlays Bitcoin’s price trajectory with the risk model’s gray line and shows red and blue visual cues to indicate high- and low-risk events, respectively. In this context, the chart shows the gray risk line approaching the lower boundary, while the frequency of red “Risk-Off” signals remains low. Blue flags, representing favorable zones, have begun to reap.
Indicator Suggests Growing Market Confidence
A particular highlight of the recent signal is the low number of red bars, which are regarded as showing investor concern or short-term trading. Its absence during a period of higher price activity suggests the overall investor sentiment or institutionalization in the market.
The subdued reading at such a price level suggests an environment potentially driven by long-term positioning and macroeconomic hedging strategies. While not predictive in isolation, the risk model identifies inflection points in market sentiment that have previously offered insight into future price behavior.
Developer: “All Models Are Wrong, But Some Are Useful”
Axel Adler Jr., the model’s developer, noted that the signal is best interpreted as a reference point rather than a guarantee. “All models are wrong, but some are useful,” Adler stated. He emphasized that the signal helps identify structural setups in the market using objective data.
In Adler’s concept, the model highlights periods during which the market acted in a manner that previously preceded changes in trends. Using data in the model eliminates any speculative measures as the model is more of a tracking device of market phases

Tomarket Daily Combo Today
Discover today’s Tomarket daily combo and boost your rewards in the Tomarket Telegram game. Learn ho...

Looking for the Best Cryptos to Buy Under $1? These 3 Coins Deliver Big on Utility
3 top cryptos under $1—Qubetics, Gala, and Arbitrum—offer real utility in gaming, scalability, and c...

Smart Cardano Whales Already Bought This Altcoin Ahead of Coinbase Debut
Cardano investors seek to overturn recent losses by participating in RCO Finance’s presale which has...


 Adler Jr (@AxelAdlerJr)