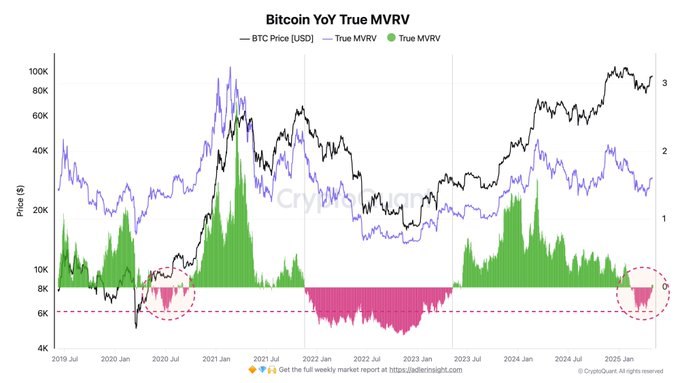
Bitcoin Enters Accumulation End Phase as MVRV Flips Positive


- Bitcoin’s YoY True MVRV flips positive, signaling reduced selling pressure.
- CryptoQuant chart shows new accumulation zone forming, similar to past market bottoms.
- CoinGlass data reveals Bitcoin is consolidating with steady gains and low short-term volatility.
Bitcoin’s on-chain indicators show renewed strength, with major metrics suggesting a possible turning point for the asset’s price cycle. As of early May 2025, the Year-over-Year (YoY) True Market Value to Realized Value (MVRV) metric has returned to positive territory.
Analysts view this change as an early signal that Bitcoin may be transitioning from a phase of uncertainty into a more stable period of growth. This shift coincides with reduced selling pressure and many profitable holders.
Recent data from CryptoQuant shows the YoY True MVRV metric, which measures the difference between market value and realized value of coins purchased over the past year, has risen above zero. This means that, on average, Bitcoin holders who acquired coins in the past 12 months are now holding at a profit. Historically, this transition from negative to positive territory in the MVRV metric has marked the beginning of recovery cycles.

On-chain analyst Axel Adler Jr. highlighted the value of this shift in a post on X, noting that fewer investors now feel the need to exit positions at a loss. This reduced selling pressure increases market stability and may signal the start of a more sustainable uptrend. According to Adler, this inflection coincides with periods where confidence returns, and holders become less reactive to short-term volatility.
Negative YoY True MVRV values, visually marked in pink on the CryptoQuant chart, have consistently appeared near historical market bottoms, including early 2020 and mid-2022. Strong price recoveries followed these periods. In May 2025, another pink zone was recently formed, raising the possibility that Bitcoin is nearing the end of its current accumulation phase.
Long-Term Price Trends Show Reduced Volatility
Supporting this view is a performance chart from CoinGlass that visualizes Bitcoin’s price changes across weekly, monthly, and quarterly timeframes. The chart reflects BTC’s high volatility since 2020, with major swings during bull markets and corrections.

Quarterly returns jumped above 300%, in the positive direction of Bitcoin’s rise to its new highs, pushing above $100,000 in late 2020 and early 2021. After that, some gains were later corrected in mid-2021 and again in mid-2022.
Conversely, Bitcoin’s growth since late 2023 has turned out to have more constant gains with less volatile corrections. The latest data on the weekly and monthly bars, up to early 2025, indicates smaller movements, indicating market price consolidation. But with the short term halt there are positive returns on a quarterly level, therefore the trend higher is more broad than short.
At present, Bitcoin is trading at nearly the $96,000 mark, while the True MVRV remains stable. Similar patterns as observed on previous recovery stages are seen in that divergence between realized value metrics and market price. As long as this continues,
Bitcoin
could be on the cusp of the next leg up in its long term, which is bolstered by strengthened investor position and on chain fundamentals.

Qitmeer Partners with iLuminaryAI to Elevate DeFi Security and Access
With this collaboration, the entities endeavor to strengthen consumers with greater confidence, tran...

PowerPool Leads Top Crypto Gainers with 156.9% Rally on May 2
PowerPool (CVP) jumps 156.9% to top May 2 crypto gainers, with strong moves from Pundi AI, EGP, IMX,...

Lumia Leads the Charge as Institutions Embrace Tokenized Real-World Assets
Lumia is building itself as one of the key enablers in the evolution of tokenized real estate by dev...


 Adler Jr (@AxelAdlerJr)