Cardano ‘Looks Dope,’ Analyst Predicts Big Move Soon


Cardano (ADA) is hovering at $0.71, but the weekly structure that veteran chartist Maelius (@MaeliusCrypto) published on X suggests that the lull may be only a pause before the next leg higher. The analyst’s chart compresses seven years of ADA/USD history into one pane and shows that – despite a 45 % retracement from the late-2024 peak – the coin has not violated the rising dashed trend-line that has connected every cycle low since the 2020 Covid panic.
Cardano Price Ready For Liftoff?
In fact, the most recent dip stopped inside a long-standing demand band that now stretches from roughly $0.57 to $0.78 and immediately printed a textbook higher low (HL) while never closing a week beneath that dynamic support. Price action is again trading above the 50-week exponential moving average, currently near $0.66, after reclaiming it with two decisive green candles.
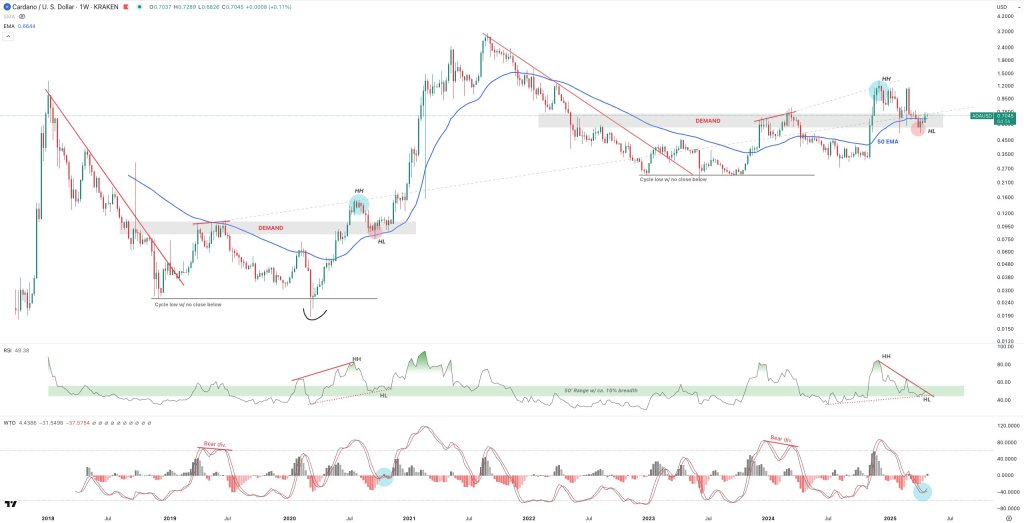
Back in March 2024 the same moving average acted as a springboard for a vertical breakout that carried ADA to a higher high (HH) just shy of $1.31 – the top of the dotted, upward-sloping channel that has contained every impulsive rally since 2020. Because the upper channel boundary now lies close to $1.50, Maelius argues that a clean break of the demand zone could unleash enough momentum to retest that ceiling.
Momentum gauges back the thesis but have not yet flashed full confirmation. The weekly relative-strength index sits at 49 and has been squeezing into a falling wedge since the March high; it is carving a sequence of higher lows that mirrors price, yet the down-sloping resistance line – drawn from the HH reading near 82 – still caps any advance. The Wave-Trend Oscillator tells a similar story: it produced a glaring bearish divergence at the 2024 top, bled into oversold territory around −50, and is only now curling upward, with the fast and slow curves on the verge of a bullish cross.
“ADA looks dope, or is just me?! Would like to see RSI breakout w/ decisive move on WTO to get super-confident, but price will be higher when (and if) we get it,” Maelius wrote when he released the chart. In other words, momentum confirmation may lag behind price, as it did in previous cycle accelerations during 2020 and 2023.
From a pure market-structure perspective, ADA remains in an unbroken sequence of higher highs and higher lows on the weekly chart, the prevailing down-trend line from the 2021 record high was breached more than a year ago, and the recent correction resembles nothing more sinister than a throw-back to new support.
As long as weekly candles respect the lower edge of the grey demand block (~$0.57) and the multi-year rising trend-line, the path of least resistance points north – with the next confluence of resistance stacked near $0.81 (the March-2024 swing high) as well as the December 2024 high at $1.31 and the upper channel wall around $1.50.
Should the RSI pierce the 60 level and the Wave-Trend Oscillator confirm with a bullish cross, Maelius contends that the market will already be trading at materially higher prices , validating his conviction that a fresh surge is only a matter of time.
At press time, ADA traded at $0.709.
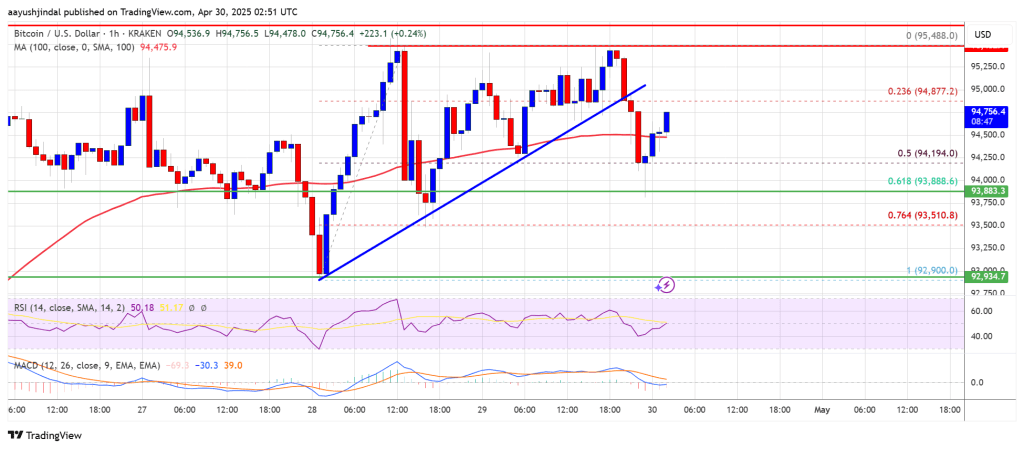
Bitcoin Price Steady Above Key Levels — Ready for a New Push Higher?
Bitcoin price is consolidating gains above the $94,000 zone. BTC is again rising and might aim for a...

Don’t Blink—Dogecoin May Create Millionaires This Quarter, Analyst Says
A recent technical report indicates Dogecoin (DOGE) could be on the verge of a significant price inc...
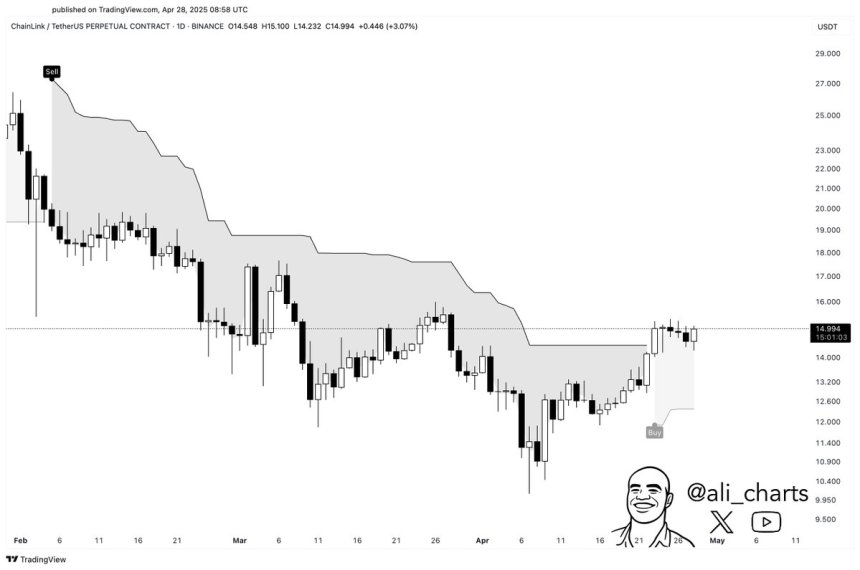
Chainlink Flashes Daily Buy Signal – Breakout Next?
Chainlink (LINK) is currently consolidating around the $15 level, as bulls attempt to reclaim higher...